DIS Momentum Weakens: Stock Gains 1.91% (September 15, 2026)
On September 15, 2026: price 108.59 USD, trend uptrend, RSI 58.7, support 103.50, resistance 111.25. technical analysis of dis stock. DIS Momentum Weakens —…

Disney’s shares rose to 108.59 USD on 14 September 2026, up 1.91% from the previous close, and the move keeps the stock above its short-term trend line even as momentum remains mixed. On the chart, the message is not that Disney is breaking out cleanly, but that it is still holding the middle of its recent range while volatility compresses — a setup that can turn quickly once price tests the edges of the band.
Trend & Price Action
The stock is still in an uptrend, with the SMA20 at 107.02 and the SMA50 at 102.04, while price sits above the SMA20. That positioning matters because it shows buyers are still defending the short-term average rather than letting the chart roll over into a weaker structure. The SMA20’s 0.40%/5-day slope suggests the trend is rising, but only gradually — this is a constructive signal, not a strong acceleration.
There has been no new MA-cross, so the chart is not flashing a fresh trend-change event. In plain terms, Disney is not getting a new technical boost from moving-average crossover momentum; it is simply holding an existing positive structure. The share price is also 66% through the 20-hour range, which places it closer to resistance than support, but still below the upper edge of the recent trading corridor.
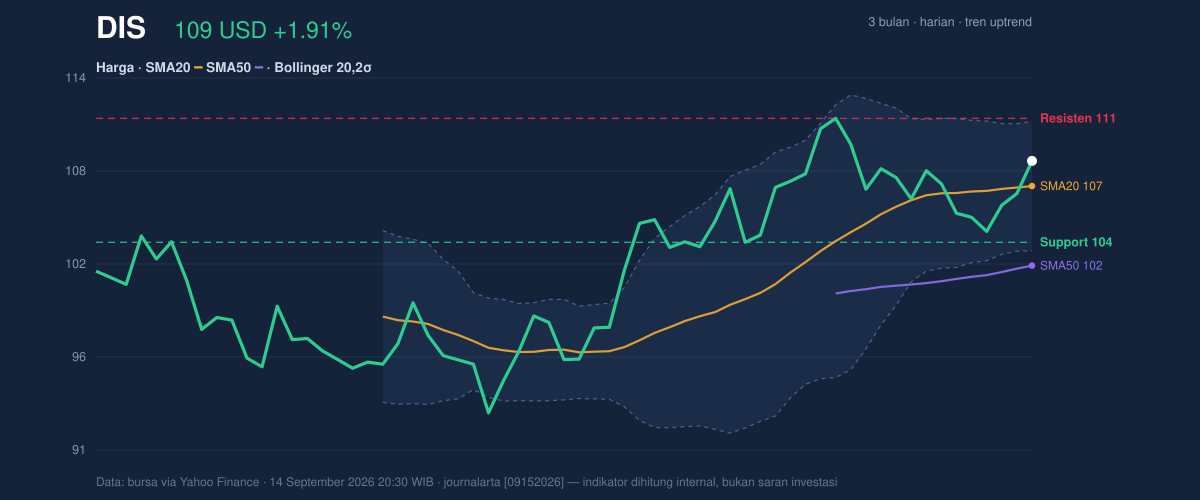
The key price map is clear: support at 103.50 and resistance at 111.25. With the 3-month high at 111.87, the stock is now pressing into a zone where prior supply has already appeared.
A short step higher, but not yet a clean escape.
Oscillators & Momentum
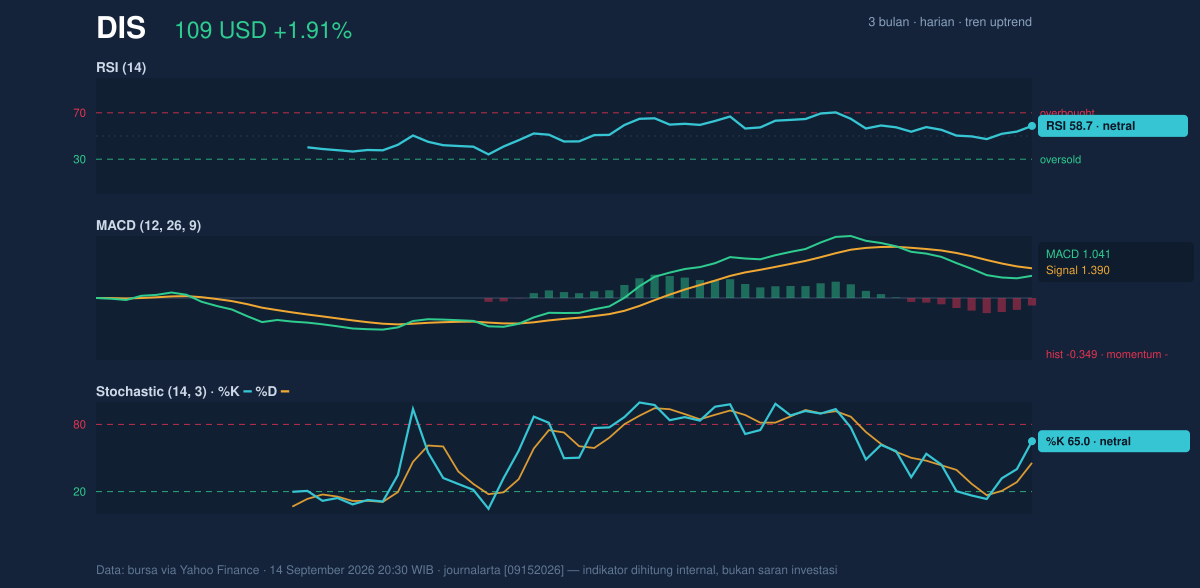
Momentum is less decisive than the price trend. The RSI at 58.7 is neutral-to-firm, which means the stock is not overbought and still has room to extend, but it is also not showing the kind of force usually associated with a strong breakout. The Stochastic %K at 65.0 and %D at 45.7 are also neutral, with %K above %D, a mild short-term positive, but not a powerful one.
The more important warning sits in the MACD at 1.041 versus the signal at 1.390, with a -0.349 histogram. That negative histogram means the faster line has slipped below the signal line, a sign that upside momentum is fading even while price remains above its moving averages. This is the kind of divergence traders watch closely: price can still drift higher, but the underlying push is weaker than the chart headline suggests.
In other words, Disney is rising, but the engine is not firing hard.
Volatility & Volume
The Bollinger Bands are tightening, with the upper band at 111.07, the middle at 107.02, and the lower at 102.96. The 7.6% band width indicates a squeeze, which often precedes a larger move. Squeezes do not predict direction by themselves; they simply say the market has become quieter and is storing energy. The fact that price is sitting at %B 69% shows Disney is trading in the upper half of the band, but not at an extreme. That leaves room to probe resistance, though not enough to call the move stretched.
Volatility is moderate, with ATR(14) at 2.14, or about 2.0% of price. That means a normal daily swing is still meaningful, but not unusually violent. For readers, ATR is a measure of typical movement size; here it suggests any breakout or rejection around resistance could travel with enough range to matter.
Volume is more cautionary. The latest print of 7,171,700 shares is just under the 20-day average of 7,543,475, about 1.0x normal. That is not a strong participation signal. More importantly, OBV is falling, which implies the balance of volume has not been confirming the recent price lift. When price rises but OBV declines, the rally can look steadier than the underlying demand really is.
Key Levels & Scenarios
The immediate battle is between support at 103.50 and resistance at 111.25, with the upper Bollinger band at 111.07 sitting almost on top of resistance. That overlap makes the zone especially important: if Disney pushes through it with stronger participation, the chart could open the door toward the 3-month high at 111.87. If it fails there, the stock may revert back toward the SMA20 at 107.02, and a deeper loss of traction would bring the lower band at 102.96 into focus.
The current setup is therefore a squeeze with mixed momentum: price is constructive, but not yet convincing enough to ignore the negative MACD and weakening OBV.
Technical Verdict: HOLD (wait & see)
HOLD (wait & see)
- Price is above the SMA20 and SMA50, which supports the broader bullish structure.
- MACD histogram is negative, showing momentum has weakened even as price holds up.
- Bollinger Bands are squeezing, so the next move may be larger, but direction is not confirmed.
- Verdict invalidated if price falls below 103.50, the nearest support and a clear sign the short-term structure is failing.
- Ideal Entry Range: 107.02 to 103.50
- Exit Target: 111.25 to 111.87
- Stop Loss Protection: below 102.96
For non-traders: Disney is still holding its trend, but the chart is asking for proof that buyers can push through resistance rather than just keep the stock afloat.
“The next move has to earn it.”
Summary Data DIS
| Last price | 108.59 USD |
| Change 1 day / 5 days / 1 month | 1.91% / 3.11% / 1.63% |
| Trend / MA-cross | uptrend / none |
| SMA20 / SMA50 | 107.02 / 102.04 |
| RSI (14) / Stochastic %K | 58.7 / 65.0 |
| Bollinger %B / ATR | 69% / 2.14 |
| Support / Resistance 20 days | 103.50 / 111.25 |
| Data as of | 14 September 2026 20:30 WIB |



