GOOGL Stock Gains 3.22% Today, Testing Key Resistance
On September 15, 2026: price 349.39 USD, trend sideways, RSI 55.0, support 330.65, resistance 349.39. technical analysis of googl stock.

International investors are watching Alphabet at a technical crossroads: the stock is pressing into the top of its recent range, but the momentum picture is not yet clean enough to call it a decisive trend break.
Alphabet’s Class A shares on Nasdaq closed at 349.39 USD, up 3.22% on the day and 3.23% over five days, according to exchange-linked market data cited via Yahoo Finance. That move matters because it lifted the stock back above both its SMA20 at 341.23 and SMA50 at 346.97, a sign that short-term price action has recovered faster than the medium-term average. But the broader setup is still described as sideways, and the SMA20 slope of -0.69% over five days says the recent bounce is happening inside a flat-to-soft structure rather than a confirmed uptrend.
The stock is also sitting at a delicate point in its band structure. As shown in the chart, the upper Bollinger Band at 351.11 is close overhead, with the middle band at 341.23 now acting as a pivot and the lower band at 331.35 marking the downside boundary. With %B at 91%, price is trading near the upper edge of the band envelope, which usually means the market is stretched rather than comfortably positioned in the middle of a trend. The Bollinger band width of 5.8% is relatively tight and is described as a squeeze, a setup that often precedes a larger move. In plain English: the stock is compressed, and compressed stocks can move sharply once they choose a direction.
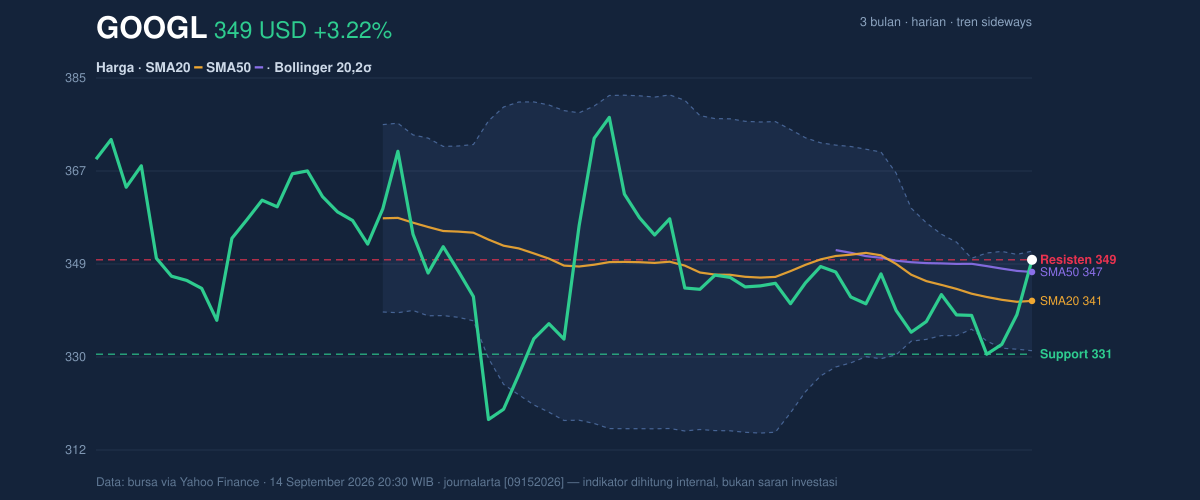
That compression is happening near the top of the 3-month range, not the middle. The stock’s 3-month high is 384.48 and its 3-month low is 314.90, while the latest print also matches the listed 20-hour resistance at 349.39. The fact that price is at 100% of the recent range tells readers the market has already used up a lot of the easy upside inside this short window. It does not mean the move is finished, but it does mean fresh progress would need follow-through rather than just a one-day bounce.
Momentum is where the signal becomes more nuanced. The RSI at 55.0 is neutral, which means the stock is not overheated on that measure and still has room to advance without immediately looking extended. But the Stochastic %K at 96.6 versus %D at 54.0 is overbought, a classic sign that the latest push has been fast and may need a pause. That does not automatically mean reversal; it means the short-term price has run ahead of its average pace and may be vulnerable to consolidation if buyers hesitate.
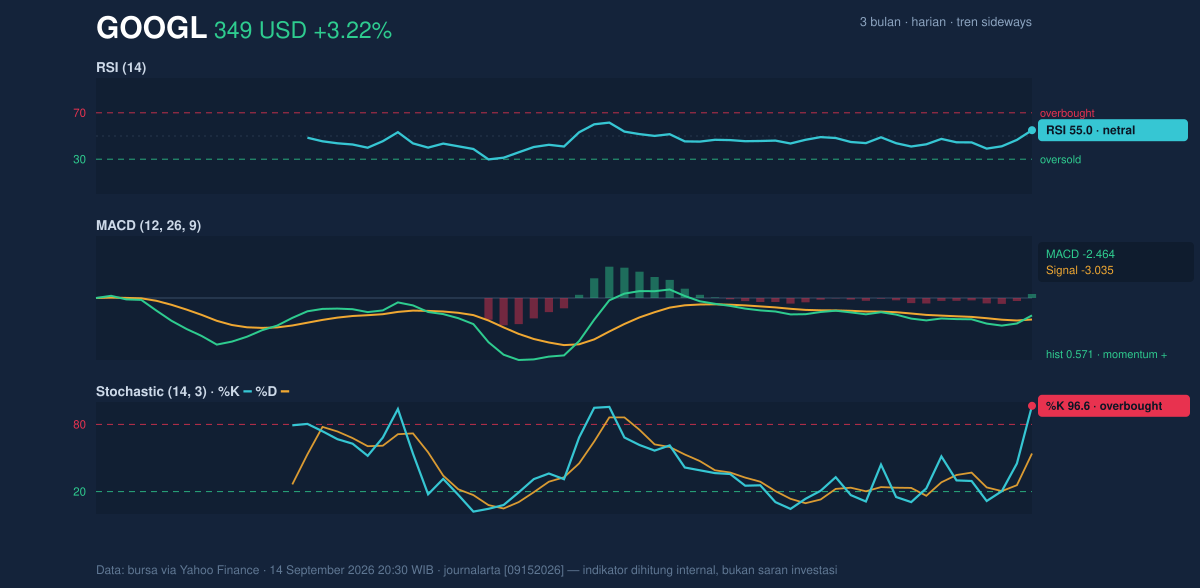
The MACD adds a more constructive layer. With MACD at -2.464, the line is still below zero, which usually reflects that the broader underlying trend has not fully turned positive. Yet the signal line at -3.035 sits lower still, and the histogram at 0.571 is positive, showing that downside momentum has eased and the shorter-term trend is improving relative to its own baseline. In technical terms, momentum is recovering before the trend is fully repaired. That combination often appears during transition phases, not during mature rallies.
Volume supports the idea that this move has real participation, but not full conviction. Last volume was 35,860,000, about 1.5× the 20-hour average of 23,818,450. That is the kind of jump traders like to see when price approaches resistance, because it suggests the move is not happening in an empty market. However, OBV is down, and that matters: on-balance volume is a cumulative measure of whether money is flowing in or out. A falling OBV while price rises can hint that the rally is not yet broadly confirmed by accumulation. In other words, the tape is active, but not fully persuasive.
The range structure now becomes the key map. Immediate upside is capped by the upper Bollinger Band at 351.11, with the latest close already near that line. A clean push above that area would be the first sign that the squeeze is resolving upward. On the downside, the SMA20 at 341.23 and the lower Bollinger Band at 331.35 frame the nearest areas where buyers would be expected to defend. If price slips back under the middle band, the recent bounce starts to look more like a mean-reversion move than the beginning of a stronger trend. If it fails to hold the lower band, the market would be telling investors that the squeeze resolved against the latest advance.
Technical Verdict: HOLD (wait & see)
HOLD (wait & see)
- Why this verdict: the price is above SMA20 at 341.23 and SMA50 at 346.97, but the broader setup is still sideways with a -0.69% SMA20 slope.
- Momentum is mixed: RSI 55.0 is neutral, while Stochastic 96.6/54.0 is overbought; meanwhile MACD histogram 0.571 is positive, showing improvement but not full confirmation.
- Volatility is compressed: the 5.8% Bollinger squeeze suggests a larger move may be coming, but direction is not yet confirmed; OBV down tempers confidence in the advance.
- Verdict invalidated if price falls below 331.35, the lower Bollinger Band and the nearest downside structure in the data.
- Ideal Entry Range: 341.23 to 346.97
- Exit Target: 351.11
- Stop Loss protection: 331.35
For non-traders, that means Alphabet is moving better, but the chart is still asking for proof before the latest rebound can be treated as more than a sharp short-term recovery.
“The next move may be bigger than the last one — but the market still has to choose it.”
Summary Data GOOGL
| Last price | 349.39 USD |
| Change 1 day / 5 days / 1 month | 3.22% / 3.23% / 1.01% |
| Trend / MA-cross | sideways / none |
| SMA20 / SMA50 | 341.23 / 346.97 |
| RSI (14) / Stochastic %K | 55.0 / 96.6 |
| Bollinger %B / ATR | 91% / 7.49 |
| Support / Resistance 20 days | 330.65 / 349.39 |
| Data as of | 14 September 2026 20:30 WIB |


