OCBC Stock Gains 0.79% Today, Testing Key Resistance
On September 15, 2026: price 31.85 SGD, trend sideways, RSI 61.8, support 30.78, resistance 32.27. technical analysis of ocbc stock. OCBC Stock Gains — full…

OCBC Bank’s shares on SGX last changed hands at 31.85 SGD, up from the previous close of 31.60, with the stock sitting above its 20-day moving average at 31.41 and well above the 50-day average at 29.93. That positioning matters because it shows the medium-term trend is still intact, even if the tape is not showing a clean directional breakout yet. As shown in the chart, the price is trading in the upper part of its recent range, but the signals underneath are mixed rather than emphatic.
Trend & Price Action
The broader read is sideways, not trending sharply higher, and that is consistent with the very modest 0.08% five-day slope in the SMA20. In plain terms, the short-term average is edging up, but only gently, which usually signals consolidation rather than a strong new leg. The stock’s 1-month gain of 0.95% and 1-day rise of 0.79% show buyers are still present, yet the 5-day change of -0.09% says momentum has not fully followed through.
The price is also trading at 72% of the 20-hour range, which places it closer to resistance than support. That is constructive, but it also means the market is already leaning toward the upper end of the recent band. The 3-month high of 32.57 sits just above the current setup, so the stock is not far from a level that could attract fresh attention if volume expands.
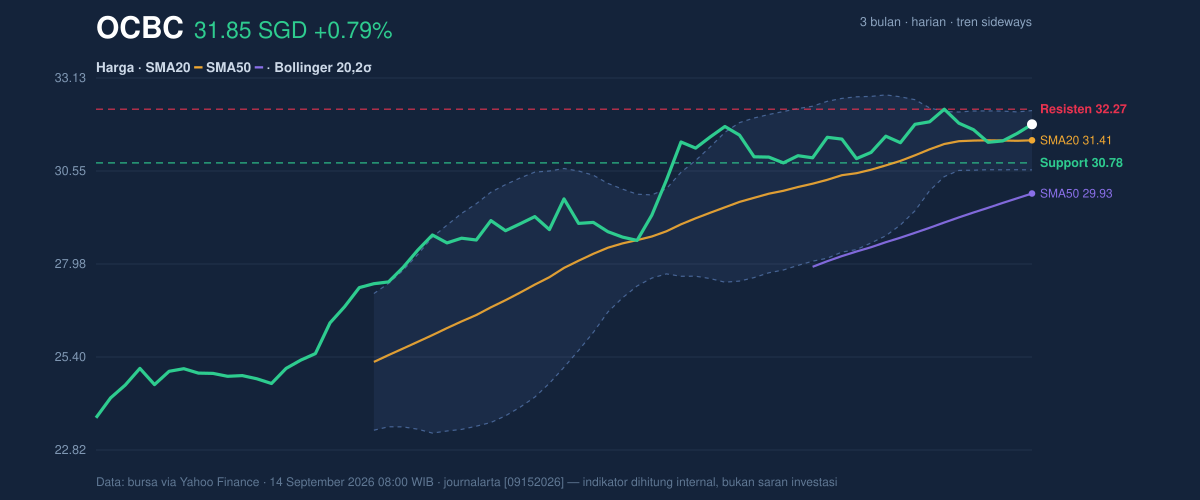
The Bollinger Bands help explain the setup. The band width is only 5.2% and is narrowing, a classic squeeze pattern that often precedes a larger move. A squeeze does not tell direction by itself, but it does tell traders the market is compressing energy. With price at %B 77%, OCBC is closer to the upper band than the middle line, which suggests the stock is leaning bullish inside the range, though not yet in an overextended state.
Oscillators & Momentum
Momentum is the part of the chart that looks less convincing. The RSI at 61.8 is neutral-to-firm, meaning the stock is not overbought and still has room to extend, but it is also not showing the kind of strong momentum that usually accompanies a decisive breakout. The Stochastic %K at 58.1 and %D at 45.0 are also neutral, with %K above %D, which is mildly supportive but not forceful.
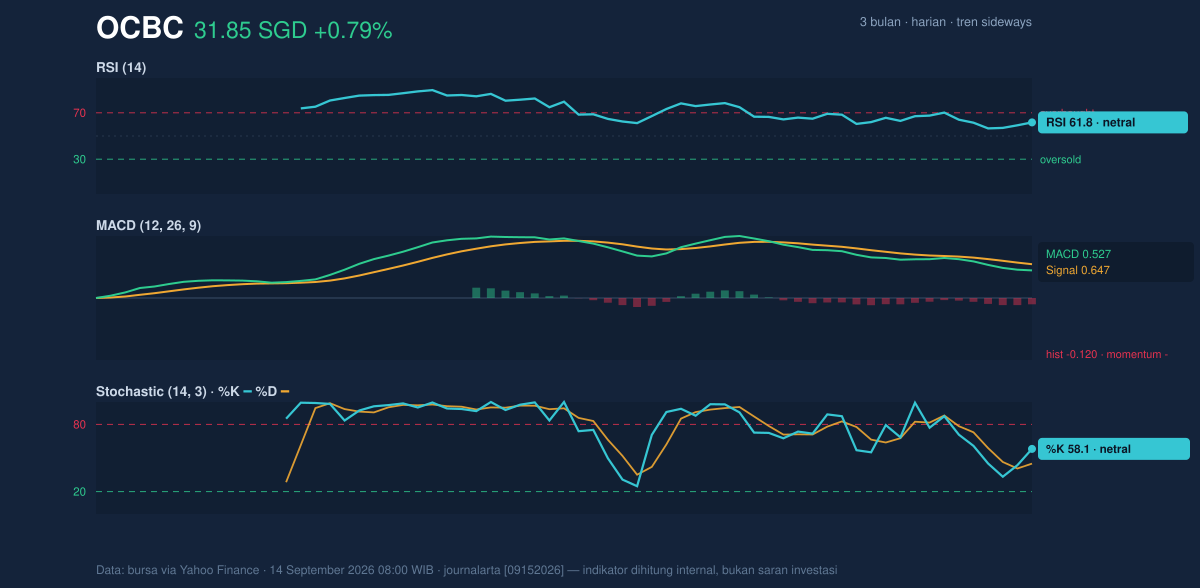
The more important warning comes from MACD. The MACD at 0.527 remains positive, which means the broader trend has not broken down, but it is sitting below the signal line at 0.647 and the histogram is -0.120. That negative histogram tells you the pace of upside momentum has slowed. In practical terms, the stock is still trending above its averages, but the internal thrust is weaker than the price alone suggests. That is often what a mature consolidation looks like before either a breakout or a stall.
Volatility & Volume
Volatility is moderate. The ATR(14) at 0.48, or 1.5% of price, suggests daily swings are contained rather than wild. Combined with the Bollinger squeeze, that points to a market waiting for a catalyst rather than already in a high-dislocation phase. The question is not whether movement may come, but whether it will come with enough participation to confirm direction.
Volume does not yet provide a strong breakout signal. The latest print of 5,123,500 shares is slightly below the 20-day average of 5,372,715, or about 1.0x normal. That means the move higher has not yet been backed by a meaningful surge in trading activity. Still, OBV is rising, which is an encouraging sign because it implies cumulative buying pressure is improving even without a dramatic volume spike. In other words, the stock is being accumulated more than it is being chased.
Key Levels & Scenarios
The nearest reference points are clear. Support at 30.78 is the first line the market is likely to defend, while resistance at 32.27 is the immediate ceiling to watch. A move through resistance would matter because it would push the stock toward the 3-month high of 32.57 and would also fit the squeeze structure shown on the chart. If price fails to hold support, the argument for a constructive consolidation weakens quickly, especially because MACD momentum is already negative.
The current setup is best read as a stock that is technically firm, but not yet fully confirmed. Price is above both key moving averages, OBV is improving, and the Bollinger Bands are compressed. Against that, MACD is still below its signal line, volume is only average, and the trend itself remains sideways. That combination points to a market preparing for a move, but not one that has clearly chosen direction yet.
Technical Verdict: HOLD (wait & see)
HOLD (wait & see)
- Price is above SMA20 and SMA50, which keeps the broader structure constructive.
- MACD histogram is negative, showing momentum is weaker than the price action.
- Bollinger Bands are squeezing, so a larger move may be forming, but direction is not confirmed.
- Verdict invalidated if price breaks below 30.78, the stated support level.
- Ideal Entry Range: 30.78 to 31.41, using support and the SMA20 as the main technical zone
- Exit Target: 32.27 to 32.57, aligned with resistance and the recent 3-month high
- Stop Loss protection: below 30.78, where the support structure is no longer holding
For non-traders, this means OCBC looks steady, but the chart is still waiting for a clearer signal before it can be called decisively strong or weak. The next technical test is whether the shares can press through 32.27 after the latest squeeze in Bollinger Bands.
Summary Data OCBC
| Last price | 31.85 SGD |
| Change 1 day / 5 days / 1 month | 0.79% / -0.09% / 0.95% |
| Trend / MA-cross | sideways / none |
| SMA20 / SMA50 | 31.41 / 29.93 |
| RSI (14) / Stochastic %K | 61.8 / 58.1 |
| Bollinger %B / ATR | 77% / 0.48 |
| Support / Resistance 20 days | 30.78 / 32.27 |
| Data as of | 14 September 2026 08:00 WIB |



