UOB Death Cross Pressure: Stock Drops 0.10% (October 29, 2026)
On October 29, 2026: price 41.50 SGD, trend downtrend, RSI 47.3, support 39.96, resistance 43.72. technical analysis of uob stock. UOB Death Cross Pressure —…
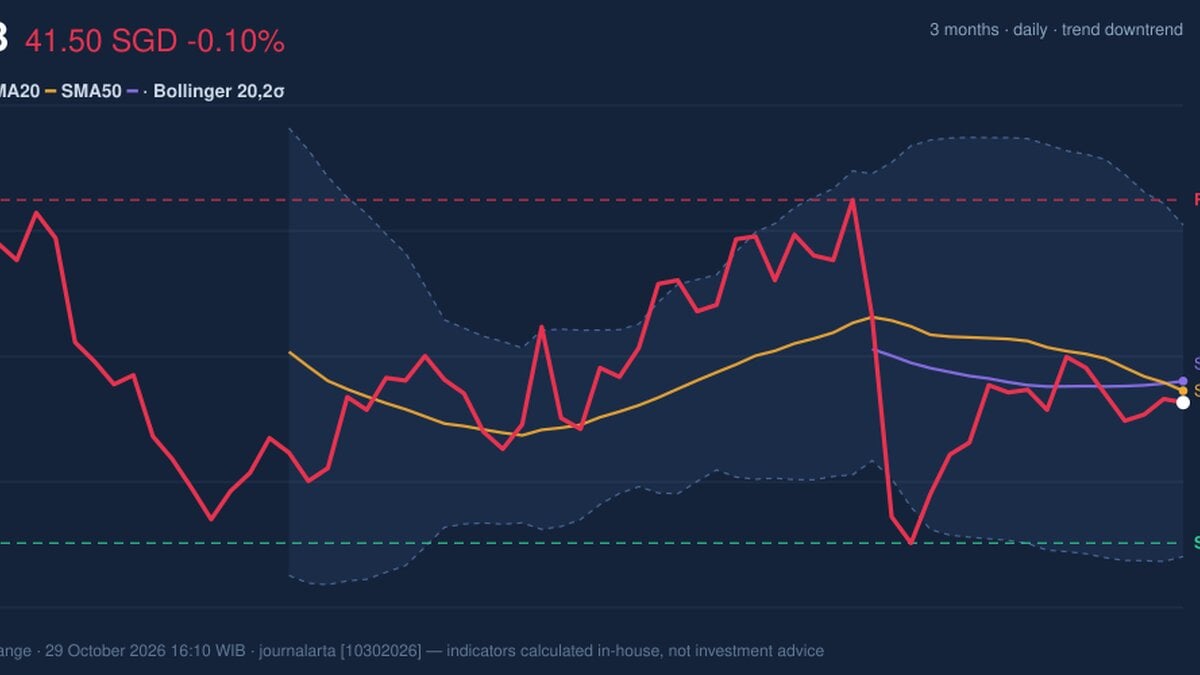
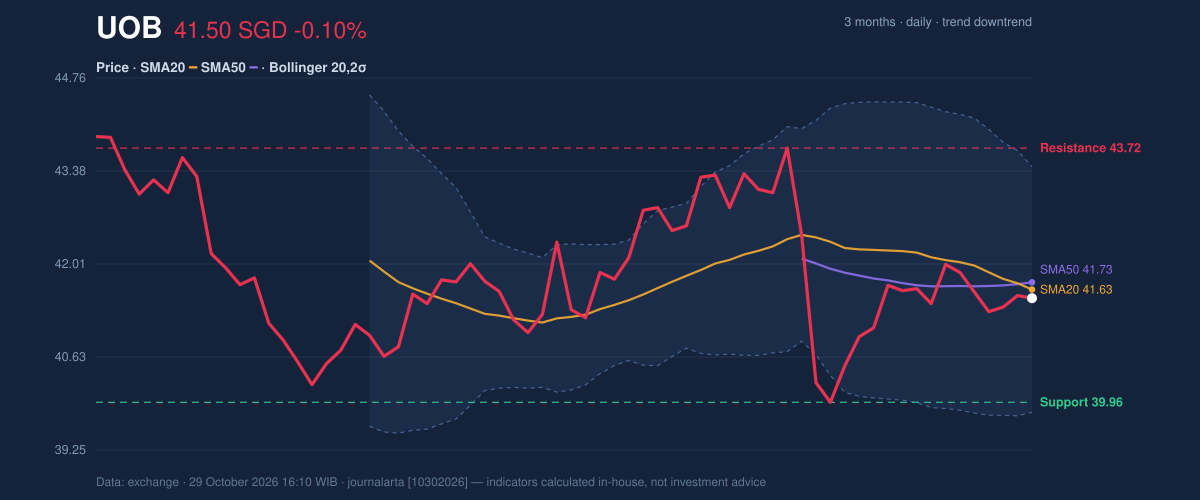
United Overseas Bank (UOB), one of Singapore's three big local lenders, ended Thursday's session on the Singapore Exchange (SGX) at S$41.50, down 0.10% on the day from a previous close of S$41.54, as its 20-day moving average sliced below the 50-day average on the latest session. That "death cross" is the kind of signal chart readers watch, yet it arrived on the same day the MACD histogram flipped positive, leaving the stock with two clues that point in opposite directions.
Why UOB is in focus today
- Fresh death cross: SMA20 crossed below SMA50
- MACD histogram has just turned positive
Selected automatically from 16 SGX (Singapore) stocks by a technical-signal score with daily weighted randomisation — not a recommendation.
Trend & Price Action
The numbers on the trend are plain. UOB has fallen 0.91% over five days and 4.25% over one month, and it trades below its 20-day simple moving average (SMA20) of S$41.63, which in turn sits under the 50-day average (SMA50) of S$41.73. The 20-day average itself fell 0.96% over five days, so the drift is downward rather than flat. A death cross simply means the shorter-term average, which reacts faster to recent prices, has dropped beneath the slower one; it confirms that the past few weeks of trading have been weaker than the past few months. Here the crossover happened on the latest session, so it is fresh, but the gap between the two averages is just S$0.10, which makes it a marginal signal rather than a decisive break.
As shown in the chart, price sits inside a fairly orderly range. The 20-day support is at S$39.96 and resistance at S$43.72, with the three-month low and high at S$39.40 and S$43.94. At S$41.50 the stock is about 41% of the way up its 20-day range, below the midpoint, which fits the cautious tone of the averages.
Oscillators & Momentum
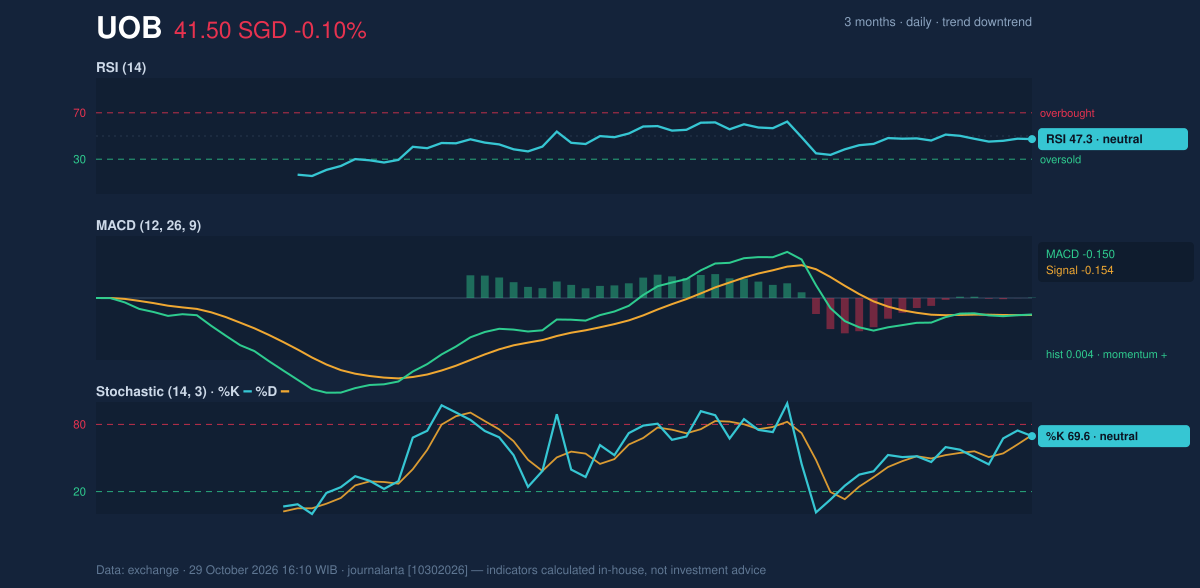
Momentum indicators, which measure how quickly prices are moving rather than where they are, do not show stress. The 14-day Relative Strength Index (RSI), which runs from 0 to 100 and flags overbought conditions near the top and oversold near the bottom, reads 47.3, neutral. The Stochastic oscillator, which compares the close with its recent high-low range, shows %K at 69.6 and %D at 70.5, also neutral, though it is closer to the upper zone than the RSI suggests. That gap hints that the latest bounce within the range has been stronger than the month-long slide implies.
The MACD, a gauge built from the difference between two moving averages, stands at -0.150 against a signal line of -0.154. The histogram, which shows the distance between the two, is a slim +0.004. It has only just turned positive, meaning downward pressure is easing, but with MACD still below zero this is a pause in selling and not yet a recovery. A reading this small can reverse within a session or two.
Volatility & Volume
The Bollinger Bands, which draw a channel two standard deviations around the 20-day average, run from S$39.81 to S$43.44 with the middle line at S$41.63. Band width of 8.7% is normal, and the %B reading of 46% places the price just under the middle, so neither squeeze nor stretch is in play. The 14-day Average True Range (ATR), a measure of typical daily movement, is S$0.66, or 1.6% of the price, which points to moderate volatility: a move of roughly two thirds of a Singapore dollar in a day would be ordinary.
Participation is the weak link. Volume on Thursday was 1,860,980 shares, about half (0.5 times) the 20-day average of 3,670,707, and On-Balance Volume (OBV), which adds volume on up days and subtracts it on down days, is falling. Thin trading means the death cross is not being driven by heavy selling, but falling OBV shows that money has been leaving on balance over recent weeks, so the bounce lacks volume backing.
Key Levels & Scenarios
If UOB moves back above the SMA50 at S$41.73 and then the Bollinger midline area near S$41.63 holds as support, the death cross would lose some of its force. A push toward the S$43.44 upper band and S$43.72 resistance would need stronger volume to be convincing. If price slips under the lower band at S$39.81 and then the S$39.96 support, the three-month low of S$39.40 comes into view.
Technical Verdict: HOLD (wait & see)
The indicators lean HOLD (wait & see) for three reasons:
- The death cross and a price below the SMA20 point to a weak trend, but the two averages are only S$0.10 apart.
- The MACD histogram has just turned positive while RSI at 47.3 stays neutral, so selling pressure is easing without a clear reversal.
- Volume at 0.5 times average and a falling OBV mean neither side has conviction.
Levels drawn strictly from the data:
- Entry range: S$39.96 to S$41.63, between 20-day support and the SMA20/Bollinger midline.
- Exit target: S$43.44, the upper Bollinger band, with S$43.72 resistance as the extended level.
- Stop loss: below S$39.81, the lower Bollinger band, close to the S$39.96 support.
The verdict is invalidated if price falls below S$39.40, the three-month low, or if it closes above S$43.72 resistance on rising volume. In plain terms, the chart shows a stock that has stopped falling quickly but has not yet shown it can climb, so waiting for clearer direction fits the evidence. This is technical analysis, not an investment recommendation.
The next test comes at Friday's SGX session, when traders will see whether the MACD histogram stays positive and whether UOB can reclaim the S$41.63 to S$41.73 band.
Summary Data UOB
| Last price | 41.50 SGD |
| Change 1 day / 5 days / 1 month | -0.10% / -0.91% / -4.25% |
| Trend / MA-cross | downtrend / death |
| SMA20 / SMA50 | 41.63 / 41.73 |
| RSI (14) / Stochastic %K | 47.3 / 69.6 |
| Bollinger %B / ATR | 46% / 0.66 |
| Support / Resistance 20 days | 39.96 / 43.72 |
| Data as of | 29 October 2026 16:10 WIB |
Disclaimer: This technical analysis is generated automatically from exchange data and indicators calculated by JournalArta, for information and education only. The verdict and the entry, target and stop-loss levels are not investment advice or a solicitation to buy or sell any security. Investment decisions and their risks rest solely with the reader.
Track UOB share price daily: live levels, support/resistance and our full UOB analysis history.