CCB Stock Gains 2.12%, Testing Key Resistance In Focus
On October 29, 2026: price 10.13 HKD, trend uptrend, RSI 63.4, support 9.51, resistance 10.13. technical analysis of ccb stock. World space week 2026 — full…
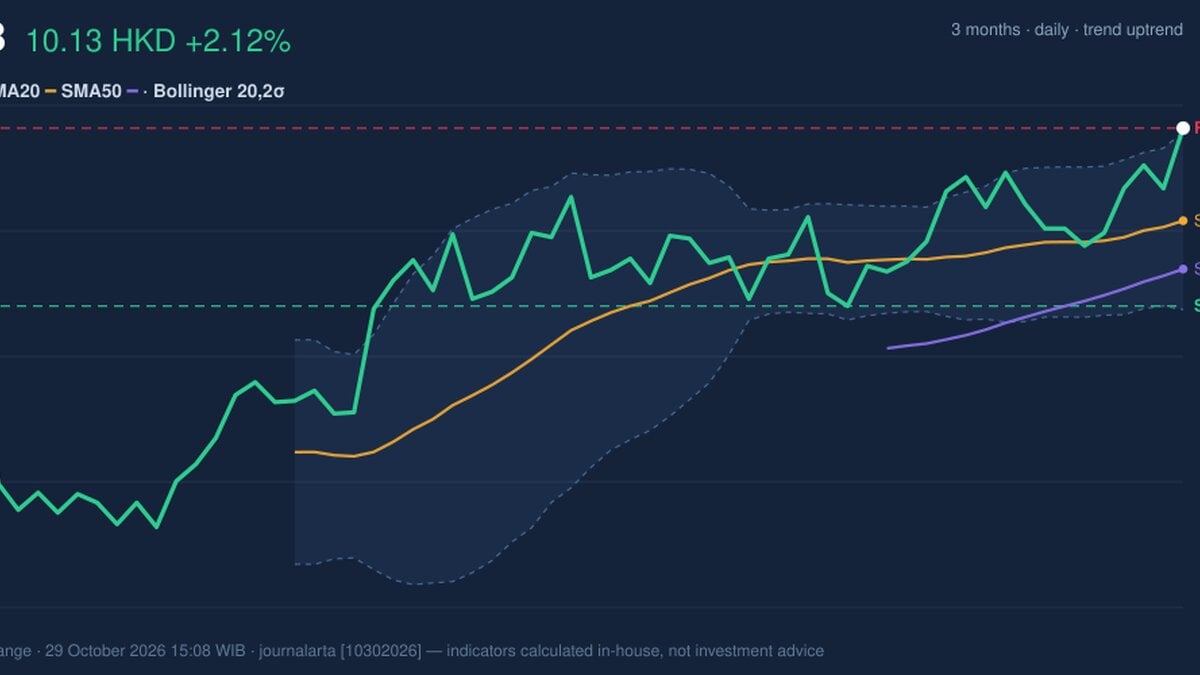
Why CCB is in focus today
- Volume at 1.6× the 20-day average
- Trading near its 3-month high (10.24)
- Breaking out of a Bollinger squeeze (band width 6.3%)
- Uptrend confirmed (5-day change 4.22%)
Selected automatically from 16 HKEX (Hong Kong) stocks by a technical-signal score with daily weighted randomisation — not a recommendation.
Trend & Price Action
The trend is upward. The price stands above the 20-day average of 9.81, which in turn sits above the 50-day average of 9.64. That ordering, short average above long average, is what analysts expect in a healthy advance. The 20-day average rose 0.77% over five days, a gentle slope that suggests the climb is steady rather than frantic. No new moving-average crossover has formed, so the signal here is continuation, not a fresh change of direction. The stock closed at the top of its 20-day range: resistance is 10.13, support 9.51, and the price sat at 100% of that band. Closing right on the ceiling means buyers were willing to pay up into the session's end, but it also means the stock has run out of room inside its recent range. The next real test is the three-month high of 10.24, only about 1% above the close. The three-month low is 8.67.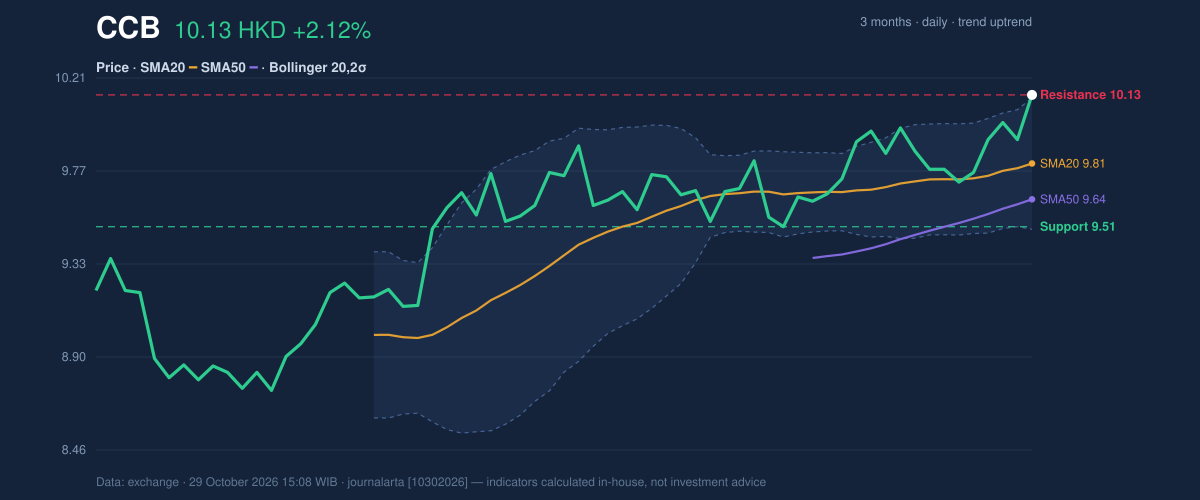
Oscillators & Momentum
Momentum indicators confirm the move but also raise a caution. The Relative Strength Index, which measures the speed of recent gains on a 0-100 scale, stands at 63.4, classed as neutral. That leaves room for further gains before it reaches the 70 level usually read as stretched. The Stochastic oscillator, which compares the close with the recent trading range, is less relaxed. Its %K reading of 82.5 and %D of 82.6 place it in overbought territory. In plain terms, the stock has been closing near its highs for several sessions, and such readings often precede a pause or small pullback, though in strong trends they can stay elevated for some time. The MACD, which tracks the gap between short- and long-term momentum, reads 0.100 against a signal line of 0.085. The histogram of 0.015 is positive, so momentum is still building, though the margin is thin.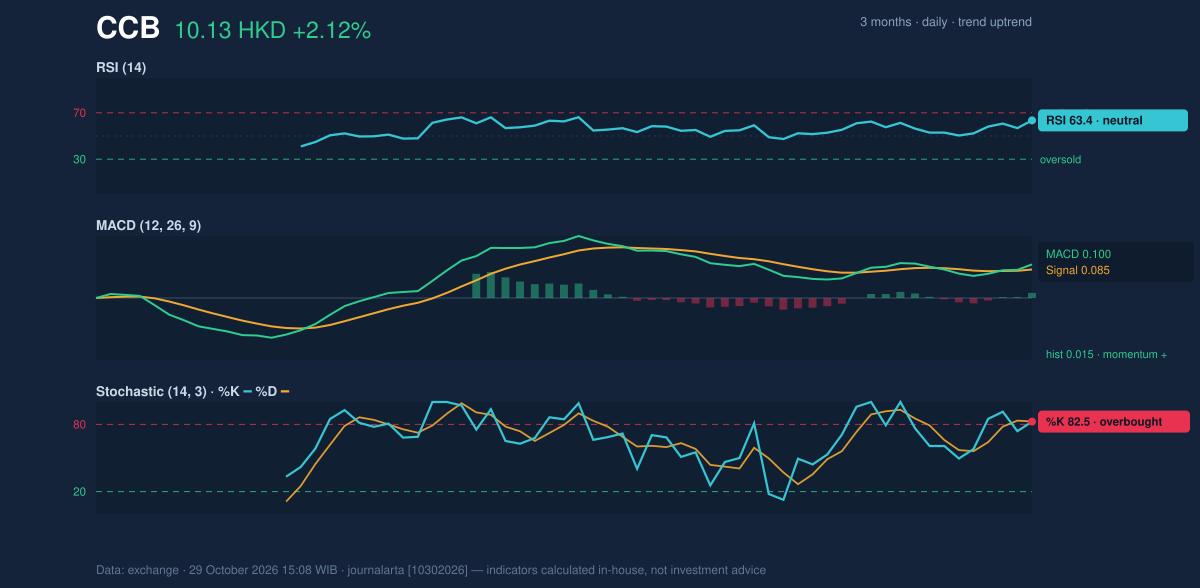
Volatility & Volume
6.3%, narrowing, a "squeeze" that usually reflects a quiet market storing up energy. The close of 10.13 landed just above the upper band, giving a %B reading of 102%, meaning the price has pushed outside the channel. A break from a squeeze can lead to a larger move, though the direction is not guaranteed, and a close outside the band can also be followed by a snap back inside. Volume gives the breakout more credibility. Thursday's turnover of 316,823,623 shares compares with a 20-day average of 194,657,788, a 1.6-times surge. On-balance volume, a running tally that adds volume on up days and subtracts it on down days, is rising, which indicates that money is flowing in rather than the price drifting up on thin trading. The Average True Range, a measure of typical daily movement, is 0.20, or 1.9% of the price, a moderate level of volatility.Key Levels & Scenarios
Above, 10.24 is the line to watch. A close beyond it would mark a new three-month high and extend the pattern of higher highs. If the stock instead slips back, the upper Bollinger band near 10.12 and the 20-day average at 9.81 are the first areas where buyers have recently stepped in, with the 20-day support at 9.51 and the lower band at 9.50 sitting close together just beneath.Technical Verdict: HOLD (wait & see)
The indicators lean positive but are stretched, so the verdict is HOLD (wait & see). - The Stochastic at 82.5 is overbought, and the close above the upper Bollinger band (%B 102%) leaves the price extended. - The price is only about 1% below the 10.24 three-month high, so the reward for waiting for confirmation is clearer than for acting now. - The trend, volume surge, rising OBV and positive MACD histogram keep the broader picture constructive. Reference levels from the data: - Ideal entry range: 9.81 to 10.12, between the 20-day average and the upper Bollinger band - Exit target: 10.24, the three-month high - Stop loss: 9.50, at the lower Bollinger band and just under 20-day support of 9.51 The verdict is invalidated if the price closes below 9.50, which would erase the squeeze breakout and the recent uptrend structure. In plain terms, the stock is climbing on solid trading, but it has risen quickly and may need to pause or prove itself above 10.24 before the picture becomes clearer. This is technical analysis, not an investment recommendation.| Indicator | Value |
|---|---|
| Last price | 10.13 HKD |
| Change (1 day / 5 days / 1 month) | 2.12% / 4.22% / 4.54% |
| SMA20 / SMA50 | 9.81 / 9.64 |
| Bollinger (upper / middle / lower) | 10.12 / 9.81 / 9.50 |
| %B / Band width | 102% / 6.3% |
| RSI(14) | 63.4 |
| Stochastic %K / %D | 82.5 / 82.6 |
| MACD / Signal / Histogram | 0.100 / 0.085 / 0.015 |
| ATR(14) | 0.20 (1.9%) |
| Volume vs 20-day average | 316,823,623 vs 194,657,788 (1.6×) |
| 20-day support / resistance | 9.51 / 10.13 |
| 3-month high / low | 10.24 / 8.67 |
Summary Data CCB
| Last price | 10.13 HKD |
| Change 1 day / 5 days / 1 month | 2.12% / 4.22% / 4.54% |
| Trend / MA-cross | uptrend / none |
| SMA20 / SMA50 | 9.81 / 9.64 |
| RSI (14) / Stochastic %K | 63.4 / 82.5 |
| Bollinger %B / ATR | 102% / 0.20 |
| Support / Resistance 20 days | 9.51 / 10.13 |
| Data as of | 29 October 2026 15:08 WIB |
Disclaimer: This technical analysis is generated automatically from exchange data and indicators calculated by JournalArta, for information and education only. The verdict and the entry, target and stop-loss levels are not investment advice or a solicitation to buy or sell any security. Investment decisions and their risks rest solely with the reader.
Track CCB share price daily: live levels, support/resistance and our full CCB analysis history.