On October 29, 2026: price 2.28 SGD, trend sideways, RSI 54.4, support 2.20, resistance 2.30. technical analysis of cict stock. CICT Testing Key Resistance —…
By Elena Vance
October 29, 20265 min read
CICT Testing Key Resistance
CapitaLand Integrated Commercial Trust, Singapore's largest real estate investment trust by market value, is trading in a tightening range that often comes before a sharper move, and the question is which way it breaks.
CICT closed at S$2.28 on the Singapore Exchange on Thursday, October 29, 2026, up 0.88% on the day from a previous close of S$2.26, according to exchange data. It is up 1.33% over five days and 1.33% over one month.
Gains, then, have been modest. A REIT (real estate investment trust) is a listed company that owns income-producing property and pays most of its earnings to shareholders, so its shares tend to move in narrow bands unless interest-rate expectations shift.
Trend & Price Action
The trend reads as sideways. The 20-day moving average, which smooths out daily noise, rose 0.49% over five days. That is a gentle upward tilt, not a strong uptrend.
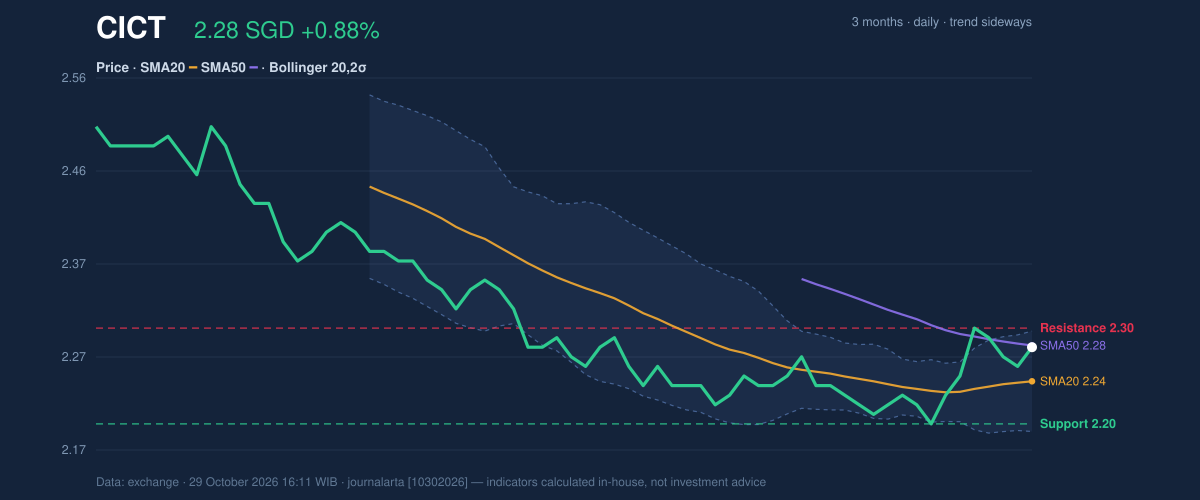
The price sits above the 20-day average of S$2.24, a mild positive sign. But it is level with the 50-day average at S$2.28, so the stock is pressing against the longer-term gauge rather than clearing it decisively. No new moving-average crossover has formed, meaning neither the short-term nor the longer-term average has recently taken the lead.
Within the 20-day range, the stock sits at about 80% of the way from support at S$2.20 to resistance at S$2.30. The three-month high and low are S$2.53 and S$2.20, so the shares trade close to the bottom of their quarterly range, well below the peak.
3-month price action chart of CICT: price, SMA20/50, Bollinger, support & resistance.
As the chart shows, price has climbed from the lower Bollinger band toward the upper one while the bands have drawn closer together.
Oscillators & Momentum
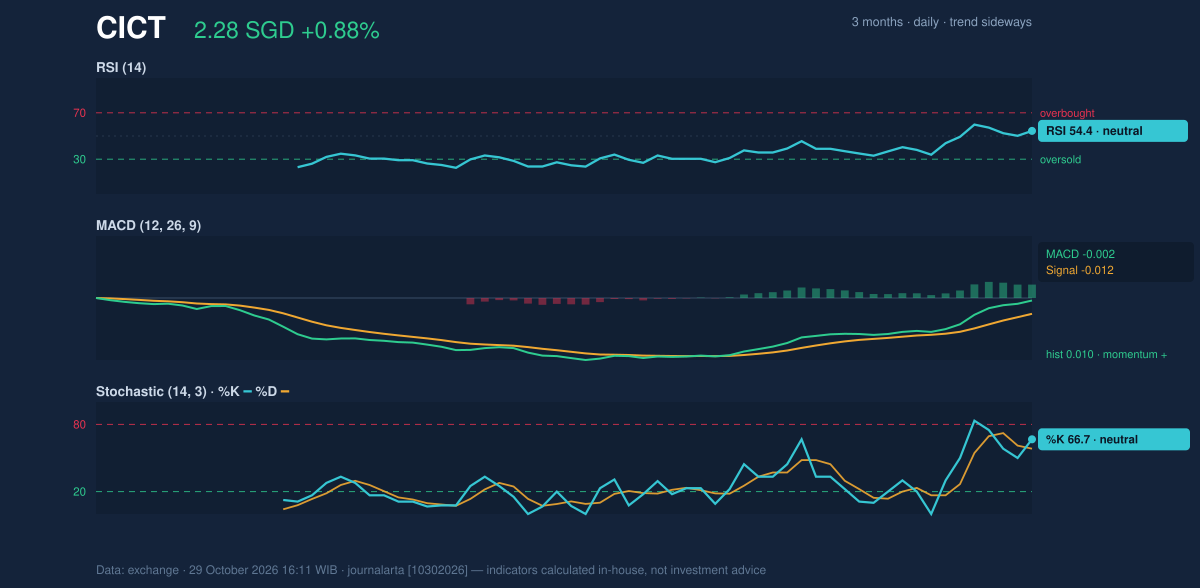
Momentum indicators are constructive but not stretched. The Relative Strength Index (RSI), which measures the speed of recent price changes on a 0-100 scale, stands at 54.4, neutral. Readings above 70 are usually seen as overheated and below 30 as depressed, so there is room in either direction.
The Stochastic oscillator, which shows where the close sits within its recent range, has %K at 66.7 and %D at 58.3, also neutral. The faster line is above the slower one, a sign that short-term buying pressure is improving.
The MACD, a gauge comparing two moving averages, is at -0.002 against a signal line of -0.012. The histogram of 0.010 shows positive momentum. The MACD line is still marginally below zero, so the improvement has not yet turned into a full trend confirmation.
Momentum chart of CICT: RSI(14), MACD, Stochastic.
Volatility & Volume
The Bollinger Bands, which draw a channel two standard deviations around the 20-day average, stand at S$2.30 (upper), S$2.24 (middle) and S$2.19 (lower). Band width is just 4.7% and is narrowing, a squeeze. Squeezes show volatility has been compressed, and historically they tend to precede a larger move, though they do not indicate direction.
The %B reading of 84% places the price in the upper part of the channel, close to the S$2.30 ceiling. That coincides with the 20-day resistance, so the same level is being tested by two separate measures.
The Average True Range (ATR), a measure of typical daily movement, is S$0.04, or 1.8% of the price, which is moderate volatility.
Volume was 30,038,700 shares, about 0.9 times the 20-day average of 34,389,849. Trading was slightly lighter than normal, so the latest advance did not come with strong participation. On-balance volume (OBV), which adds volume on up days and subtracts it on down days, is rising, suggesting buyers have had the upper hand over the longer window.
Key Levels & Scenarios
Resistance at S$2.30 is the near-term test. A close above it, ideally on heavier volume, would take price out of the upper band and the 20-day range. The next reference would be the three-month high of S$2.53, a considerable distance away.
If the stock fails at S$2.30, the 20-day average at S$2.24 and the lower band at S$2.19 become the first areas to watch. A break below S$2.20 would put the stock at its three-month low and weaken the current picture.
Technical Verdict: HOLD (wait & see)
The indicators lean mildly positive but do not yet confirm a breakout, so HOLD (wait & see) fits best.
- Squeeze: Bollinger width of 4.7% points to a coming move, but direction is unresolved.
- Resistance: the price at S$2.28 sits just beneath the S$2.30 ceiling, with %B at 84% and volume at 0.9 times normal.
- Momentum: RSI at 54.4 and Stochastic at 66.7 are neutral, while the positive MACD histogram and rising OBV give a modest upward bias.
Reference levels, based strictly on the data:
- Entry range: S$2.24 (20-day average and Bollinger middle) to S$2.20 (support), where risk is better defined.
- Exit target: S$2.30 (resistance and upper band) as the first objective; S$2.53 (three-month high) if a breakout is confirmed.
- Stop loss: below S$2.19 (lower Bollinger band and just under support).
The verdict is invalidated if price breaks below S$2.20, or turns bullish if it closes above S$2.30 with rising volume.
In plain terms, the stock is coiled near a ceiling and the evidence does not yet say which way it will go. This is technical analysis, not an investment recommendation.
The next test is whether CICT can close above S$2.30, the level it was approaching at Thursday's close.
Indicator
Value
Last price
S$2.28
Change (1 day / 5 days / 1 month)
0.88% / 1.33% / 1.33%
SMA20 / SMA50
2.24 / 2.28
Bollinger (upper / middle / lower)
2.30 / 2.24 / 2.19
%B / Band width
84% / 4.7%
RSI(14)
54.4
Stochastic %K / %D
66.7 / 58.3
MACD / Signal / Histogram
-0.002 / -0.012 / 0.010
ATR(14)
0.04 (1.8%)
Volume / 20-day average
30,038,700 / 34,389,849
Support / Resistance (20 days)
2.20 / 2.30
3-month high / low
2.53 / 2.20
Summary Data CICT
Last price
2.28 SGD
Change 1 day / 5 days / 1 month
0.88% / 1.33% / 1.33%
Trend / MA-cross
sideways / none
SMA20 / SMA50
2.24 / 2.28
RSI (14) / Stochastic %K
54.4 / 66.7
Bollinger %B / ATR
84% / 0.04
Support / Resistance 20 days
2.20 / 2.30
Data as of
29 October 2026 16:11 WIB
Disclaimer: This technical analysis is generated automatically from exchange data and indicators calculated by JournalArta, for information and education only. The verdict and the entry, target and stop-loss levels are not investment advice or a solicitation to buy or sell any security. Investment decisions and their risks rest solely with the reader.