ANTA Stock Analysis: Drops 0.63%, Testing Support Level
On October 29, 2026: price 71.45 HKD, trend sideways, RSI 43.1, support 71.10, resistance 77.95. technical analysis of anta stock. ANTA Stock Analysis — full…
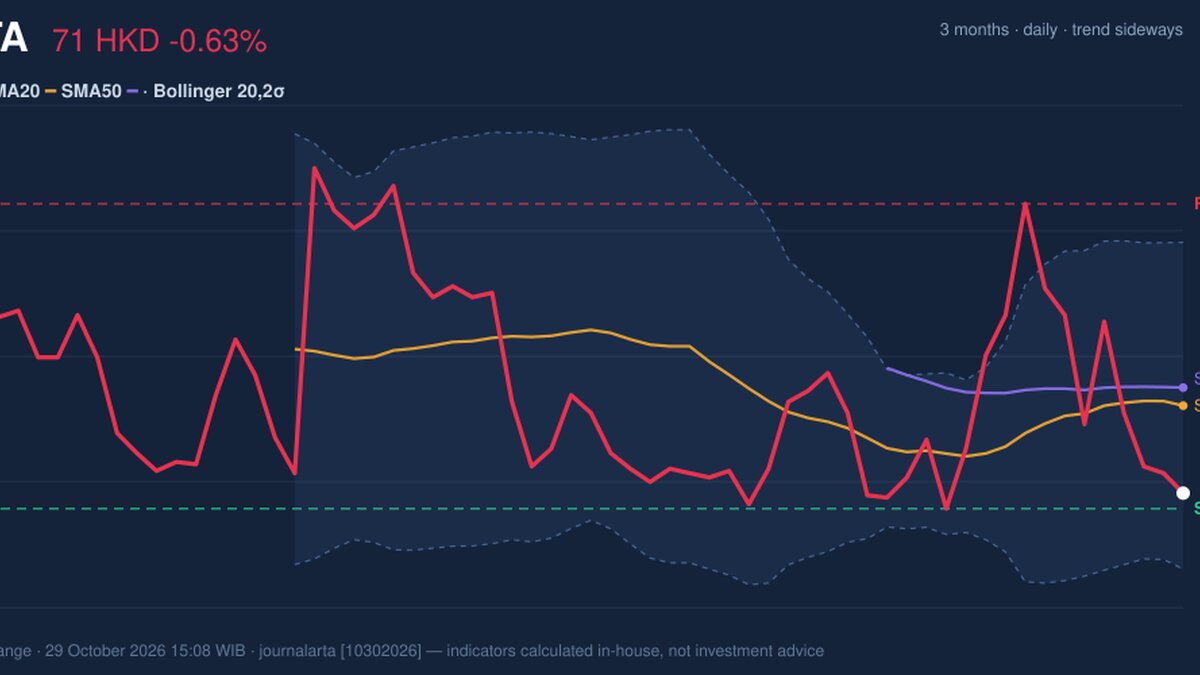
Anta Sports Products is trading within about one HKD of its three-month low, a reminder of how quickly sentiment can cool on one of Hong Kong's biggest sportswear names. The stock closed at 71.45 HKD on Thursday, October 29, 2026, down 0.63% on the day, according to HKEX data, against a three-month floor of 70.30 HKD.
Why ANTA is in focus today
- Trading near its 3-month low (70.30)
Selected automatically from 16 HKEX (Hong Kong) stocks by a technical-signal score with daily weighted randomisation — not a recommendation.
Trend & Price Action
The stock is down 2.12% over five days and 2.79% over one month. Those losses are modest, yet they have pushed the price below its 20-day simple moving average (SMA20) of 73.42. A moving average is the mean closing price over a set period. When the price sits under it, recent buyers are, on average, sitting on losses, and rallies often meet selling from those hoping to break even. The 50-day average is 73.82, so both averages now lie above the market price.
The broader trend is still sideways. The 20-day average rose just 0.24% over five days, which is close to flat. No new moving-average crossover has formed. In practice, the stock is not in a clear downtrend, but it is drifting toward the bottom of a range rather than the middle.
The range is the key. Price sits at roughly 5% of its 20-day band between support at 71.10 and resistance at 77.95. The three-month high is 80.90, the low 70.30. Put plainly, Anta is trading near the floor of a corridor, not the ceiling.
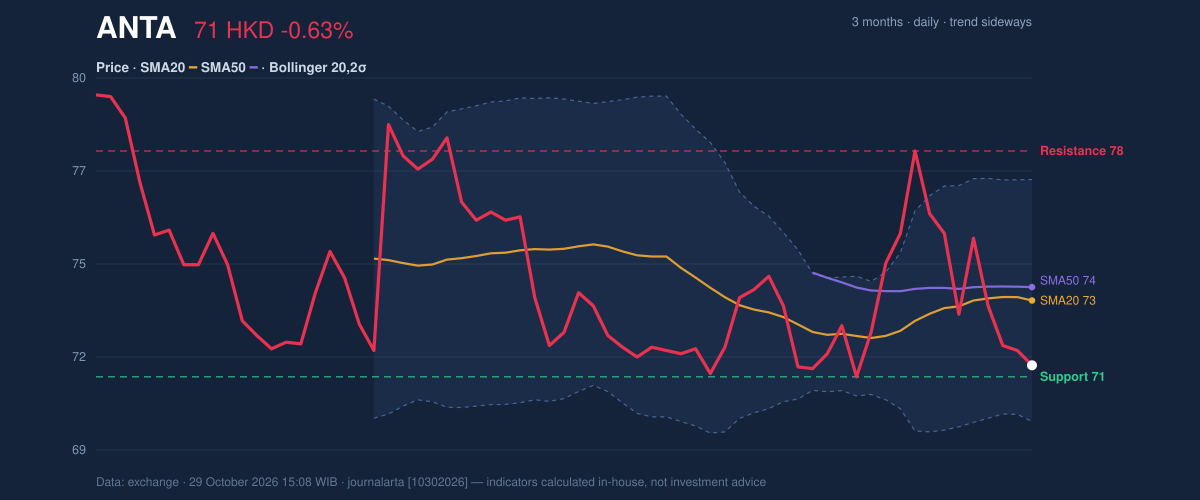
As the chart shows, the price hugs the lower part of the Bollinger Bands, a volatility envelope drawn two standard deviations around the 20-day average. The lower band is at 69.75 and the upper at 77.08. The stock's %B reading of 23% means it sits in the lower quarter of that envelope. Band width of 10.0% is normal, so there is no squeeze or sudden expansion signalling an imminent breakout.
Support is close. A break is not far away either.
Oscillators & Momentum
Momentum indicators tell a mixed story. The 14-day Relative Strength Index (RSI), which measures the speed of recent gains against losses on a 0-100 scale, stands at 43.1. That is neutral: weaker than the midpoint of 50, but nowhere near the sub-30 zone usually associated with heavy selling.
The Stochastic oscillator is more extreme. Its %K line is at 12.6 and %D at 16.8, both in oversold territory. This indicator compares the close with the recent trading range; a low reading says the stock is closing near its recent lows. Oversold can mean a bounce is near, but it can also persist in a falling market. It flags stretched conditions, not a reversal on its own.
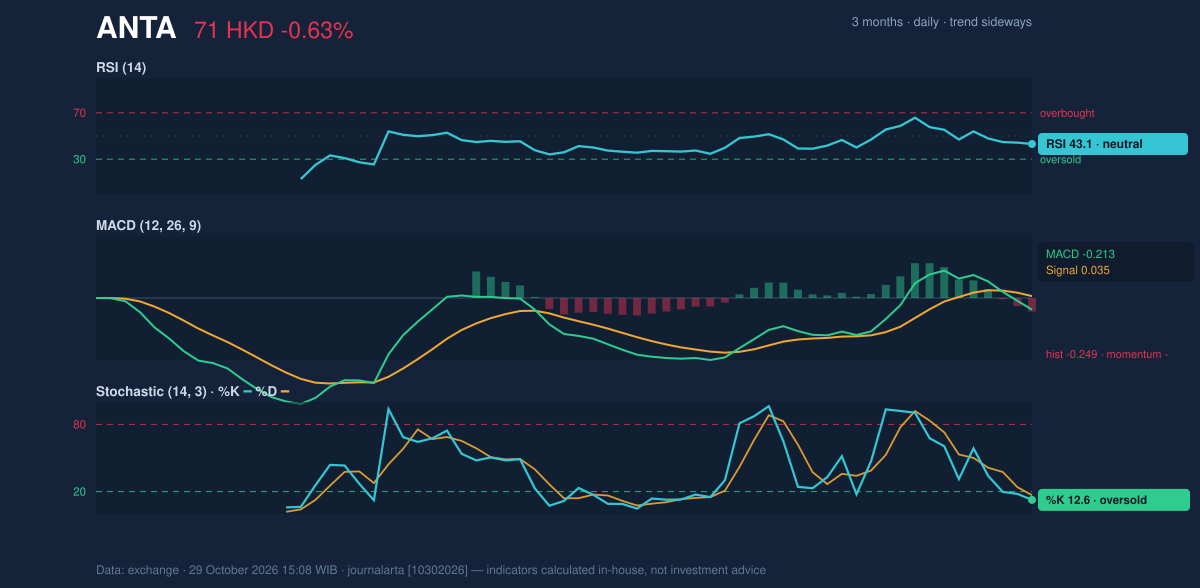
The MACD, which tracks the gap between short- and long-term averages, is less forgiving. The line is at -0.213, below its signal line at 0.035, leaving a histogram of -0.249. That is negative momentum, and it argues against reading the oversold Stochastic as a clean turning point. The two signals conflict: price is stretched to the downside, but the trend-following gauge has not turned.
Volatility & Volume
The 14-day Average True Range (ATR), a measure of typical daily price swing, is 2.66 HKD, or 3.7% of the price. That is high volatility for a large-cap. With support only about 0.35 HKD below the last close, a single average day's swing is wider than the cushion to the 20-day floor.
Participation is slightly elevated. Volume of 10,696,125 shares was 1.1 times the 20-day average of 9,939,880. Heavier turnover on a down day usually points to selling pressure rather than indifference. On-balance volume (OBV), which adds volume on up days and subtracts it on down days, is falling, confirming that more money has been leaving than entering.
Key Levels & Scenarios
The nearest line is 20-day support at 71.10, followed by the three-month low at 70.30 and the lower Bollinger Band at 69.75. If the price closes below 70.30, it would set a new three-month low and open the way toward the band floor. If support holds, the first hurdles are the SMA20 at 73.42 and the SMA50 at 73.82, which would need to be reclaimed to repair the picture. Beyond that sits resistance at 77.95.
Technical Verdict: HOLD (wait & see)
The indicators favour HOLD (wait & see), based on three signals:
- MACD histogram at -0.249 and falling OBV show momentum and volume still leaning down.
- Stochastic at 12.6 is oversold and %B is 23%, so the stock is stretched and a rebound is plausible.
- Price under both averages, with a flat 20-day slope, shows no established trend either way.
- Ideal entry range: 70.30-71.10, the zone between the three-month low and 20-day support, if it holds.
- Exit target: 73.42-73.82 (SMA20/SMA50) as a first zone; 77.95 as an extended resistance level.
- Stop loss: below 69.75, the lower Bollinger Band.
The verdict is invalidated if the price closes below 70.30, which would confirm a fresh three-month low. This is technical analysis, not an investment recommendation.
For non-traders: the stock is near the bottom of its recent range, but the signals are not yet clear enough to say whether it will bounce or slip further.
| Indicator | Value |
|---|---|
| Last price | 71.45 HKD |
| SMA20 / SMA50 | 73.42 / 73.82 |
| Bollinger (lower / mid / upper) | 69.75 / 73.42 / 77.08 |
| %B | 23% |
| RSI(14) | 43.1 |
| Stochastic %K / %D | 12.6 / 16.8 |
| MACD / signal / histogram | -0.213 / 0.035 / -0.249 |
| ATR(14) | 2.66 (3.7%) |
| Volume vs 20-day average | 10,696,125 vs 9,939,880 (1.1×) |
| Support / resistance (20-day) | 71.10 / 77.95 |
| 3-month low / high | 70.30 / 80.90 |
Summary Data ANTA
| Last price | 71.45 HKD |
| Change 1 day / 5 days / 1 month | -0.63% / -2.12% / -2.79% |
| Trend / MA-cross | sideways / none |
| SMA20 / SMA50 | 73.42 / 73.82 |
| RSI (14) / Stochastic %K | 43.1 / 12.6 |
| Bollinger %B / ATR | 23% / 2.66 |
| Support / Resistance 20 days | 71.10 / 77.95 |
| Data as of | 29 October 2026 15:08 WIB |
Disclaimer: This technical analysis is generated automatically from exchange data and indicators calculated by JournalArta, for information and education only. The verdict and the entry, target and stop-loss levels are not investment advice or a solicitation to buy or sell any security. Investment decisions and their risks rest solely with the reader.
Track ANTA share price daily: live levels, support/resistance and our full ANTA analysis history.