Wilmar Stock Drops 4.89% on Thursday, RSI Oversold
On October 29, 2026: price 3.11 SGD, trend downtrend, RSI 22.5, support 3.11, resistance 3.60. technical analysis of wilmar stock. Wilmar Stock Drops — full…
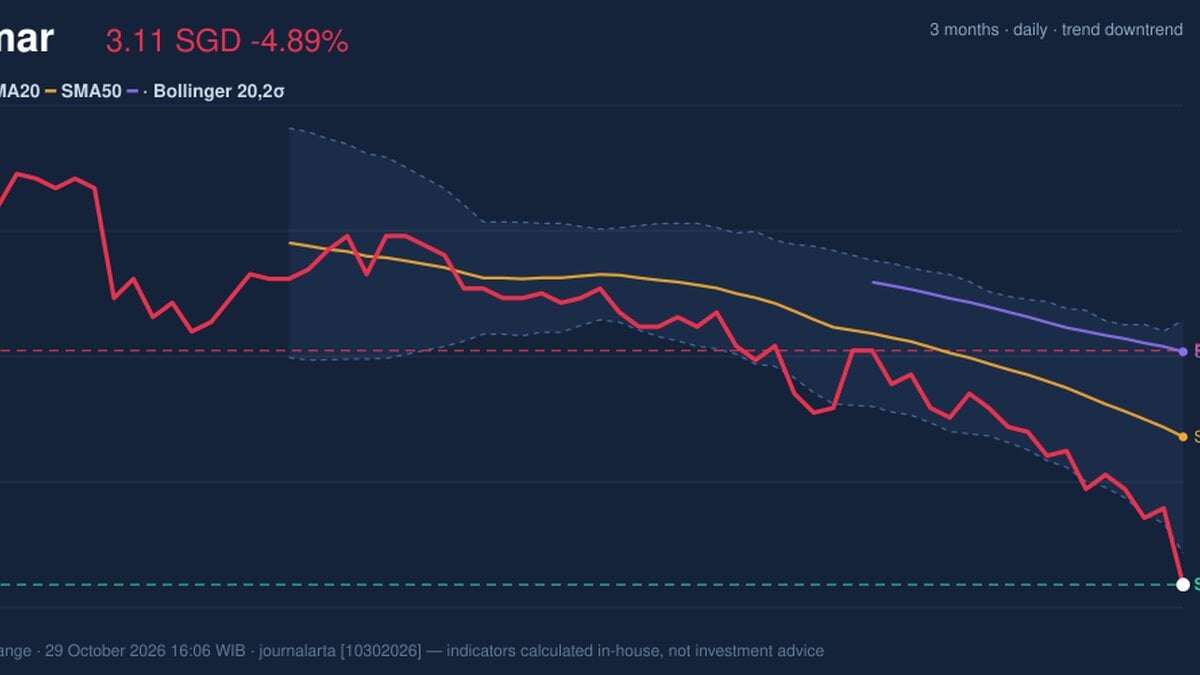
Shares of Wilmar International fell 4.89% to S$3.11 on the Singapore Exchange on Thursday, October 29, 2026, closing at the lowest level of the past three months, on trading volume of 10,539,000 shares, about 1.9 times the 20-day average of 5,414,655. The agribusiness group has lost 6.04% over five days and 11.40% over one month. Several gauges now sit in oversold territory, which means the selling has been unusually fast, but none yet shows the decline has run its course.
Why Wilmar is in focus today
- One-day move of -4.89%, about 1.9× its average daily range (ATR)
- Volume at 1.9× the 20-day average
- Trading near its 3-month low (3.11)
- RSI(14) at 22.5 — oversold zone
- Downtrend extending (5-day change -6.04%)
Selected automatically from 16 SGX (Singapore) stocks by a technical-signal score with daily weighted randomisation — not a recommendation.
Trend and Price Action
The day's drop was roughly 1.9 times the stock's average daily range, as measured by the Average True Range (ATR), a gauge of typical daily movement. The ATR stands at 0.08, or 2.6% of the price, a moderate level of volatility. A fall of this size is therefore out of character for the stock, not simply a routine swing.
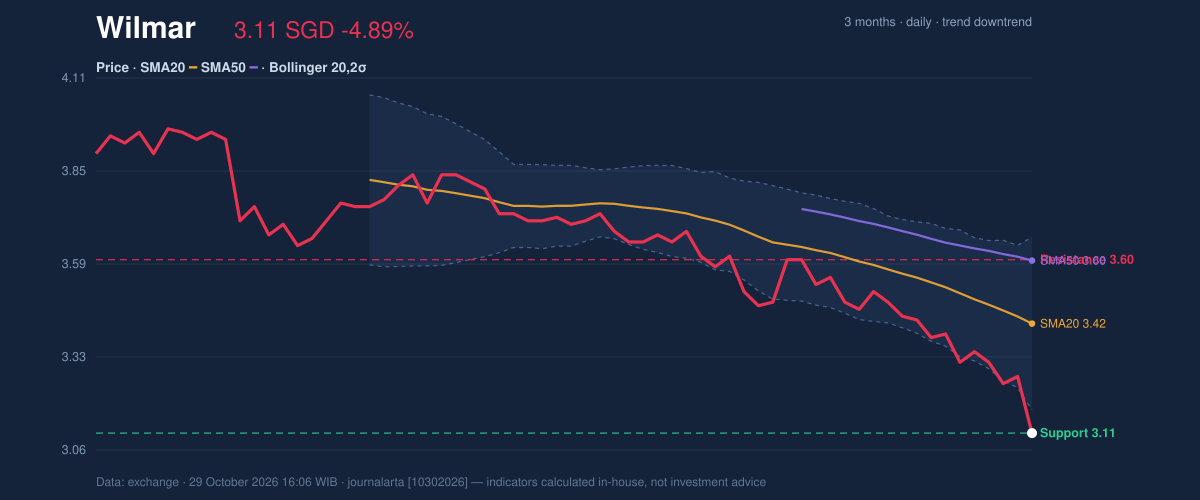
The structure remains bearish. The price is below both the 20-day simple moving average (SMA20) at 3.42 and the 50-day average (SMA50) at 3.60. The 20-day average itself fell 2.44% over five days, so the benchmark the stock must climb back toward is itself moving lower. DATA shows no new moving-average crossover, meaning the downtrend is a continuation, not a fresh trend change.
As the chart shows, the price has dropped to the bottom of its 20-day range: support and the last price are both at 3.11, with resistance at 3.60, the same level as the SMA50. The three-month range runs from a high of 4.00 to the current low of 3.11, so the stock has surrendered the entire lower end of that band in a single session.
Oscillators and Momentum
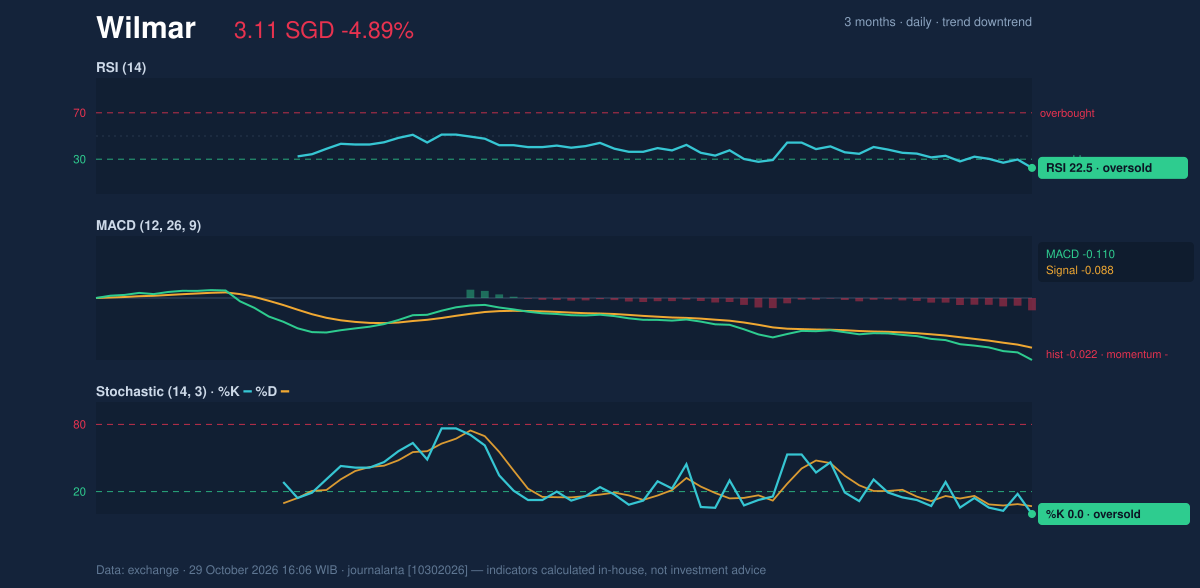
Momentum indicators are stretched. The Relative Strength Index (RSI), which compares the size of recent gains and losses on a 0–100 scale, reads 22.5, below the conventional 30 line that marks oversold conditions. The Stochastic oscillator, which shows where the close sits within its recent high-low range, has a %K of 0.0 and a %D of 6.9, meaning the stock closed at the very bottom of its range.
Oversold readings describe how hard a stock has been sold, not when it will turn. In a downtrend, these gauges can stay depressed for days, and a short rebound is often followed by renewed weakness. The Moving Average Convergence Divergence (MACD) indicator supports that caution: the line is at -0.110, below its signal line at -0.088, and the histogram of -0.022 signals that negative momentum persists rather than fading.
Volatility and Volume
The Bollinger Bands, which draw a channel two standard deviations around the 20-day average, put the lower band at 3.18, the middle at 3.42 and the upper at 3.66. The price closed beneath the lower band, with %B at -13%. A negative %B means the close is outside the channel, a sign of an extended move. The bands are 14.3% wide, a normal reading, so this is not a breakout from a tight squeeze but a push through the edge of an already established range.
Volume adds weight to the move. A 1.9-times surge on a falling day suggests active selling rather than thin trading, and On-Balance Volume (OBV), a running tally that adds volume on up days and subtracts it on down days, is falling. That confirms sellers, not buyers, are driving participation. Heavy volume near a low can sometimes mark exhaustion, but DATA offers no sign of a reversal yet.
Key Levels and Scenarios
The immediate question is whether 3.11 holds. If the stock closes below it, the market moves into new three-month lows with no reference support in the DATA. If it holds and recovers, the first hurdles are the lower Bollinger band at 3.18 and the SMA20 at 3.42, with 3.60 a more significant barrier where the SMA50 and 20-day resistance coincide.
Technical Verdict: HOLD (wait & see)
The verdict is HOLD (wait & see), based on the following:
- The price is below the SMA20 and SMA50, and the 20-day average is falling, so the trend remains down.
- RSI at 22.5 and Stochastic at 0.0 are oversold, but MACD at -0.110 below its signal line shows momentum has not turned.
- OBV is falling on 1.9-times volume, so selling pressure is still confirmed.
The technical framework for the stock is:
- Entry range: 3.11–3.18, between support and the lower Bollinger band, ideally after the price stabilises above support.
- Exit target: 3.42 (SMA20) as a first level, with 3.60 (SMA50 and resistance) as the extended level.
- Stop loss: a close below 3.11, the 20-day support and three-month low.
The verdict would be invalidated if the price breaks below 3.11, or on a close back above 3.42 that would shift the picture. In plain terms, Wilmar has fallen very far very fast, but the chart has not yet shown that sellers are done, so the technical stance is to watch rather than act. This is technical analysis, not investment advice.
The next test comes at Friday's session on the Singapore Exchange, where the stock opens with 3.11 as the line traders will be watching.
| Indicator | Value |
|---|---|
| Last price | S$3.11 (previous close 3.27) |
| Change 1 day / 5 days / 1 month | -4.89% / -6.04% / -11.40% |
| SMA20 / SMA50 | 3.42 / 3.60 |
| Bollinger (20, 2σ) | Upper 3.66 / Middle 3.42 / Lower 3.18; %B -13%; width 14.3% |
| RSI(14) | 22.5 (oversold) |
| Stochastic %K / %D | 0.0 / 6.9 (oversold) |
| MACD / signal / histogram | -0.110 / -0.088 / -0.022 |
| ATR(14) | 0.08 (2.6% of price) |
| Volume vs 20-day average | 10,539,000 vs 5,414,655 (1.9×) |
| Support / resistance (20 days) | 3.11 / 3.60 |
| 3-month high / low | 4.00 / 3.11 |
Summary Data Wilmar
| Last price | 3.11 SGD |
| Change 1 day / 5 days / 1 month | -4.89% / -6.04% / -11.40% |
| Trend / MA-cross | downtrend / none |
| SMA20 / SMA50 | 3.42 / 3.60 |
| RSI (14) / Stochastic %K | 22.5 / 0.0 |
| Bollinger %B / ATR | -13% / 0.08 |
| Support / Resistance 20 days | 3.11 / 3.60 |
| Data as of | 29 October 2026 16:06 WIB |
Disclaimer: This technical analysis is generated automatically from exchange data and indicators calculated by JournalArta, for information and education only. The verdict and the entry, target and stop-loss levels are not investment advice or a solicitation to buy or sell any security. Investment decisions and their risks rest solely with the reader.
Track Wilmar share price daily: live levels, support/resistance and our full Wilmar analysis history.