Alibaba Stock Gains 1.23% Today, Death Cross Pressure
On September 16, 2026: price 107.20 HKD, trend downtrend, RSI 39.2, support 105.90, resistance 126.20. technical analysis of alibaba stock.

Alibaba Group’s Hong Kong-listed shares rose to HKD 107.20 on HKEX, after a prior close of HKD 105.90, even as the stock remains locked in a broader downtrend and trades well below its short- and medium-term moving averages.
The move looks more like a rebound inside a weak structure than a clean trend change. As shown in the chart, the price is still below the SMA20 at HKD 112.73 and below the SMA50 at HKD 115.52, while the death cross — when the 20-day average falls beneath the 50-day average — signals that recent selling pressure has been strong enough to damage the trend. In plain terms, the market is still telling investors that rallies are being sold into rather than broadly embraced.
Trend & Price Action
The stock’s position near the lower end of its recent range matters. It is only about 6% above the 20-day support at HKD 105.90, which means the latest gain has not yet repaired the larger damage from the 1 month decline of 15.39%. The 20-day moving average is also falling, with a -3.26% slope over 5 days, reinforcing that the short-term trend remains down. That downward tilt is important because moving averages are not just lines on a chart: when they slope lower, they show that recent prices are consistently weaker than earlier ones.
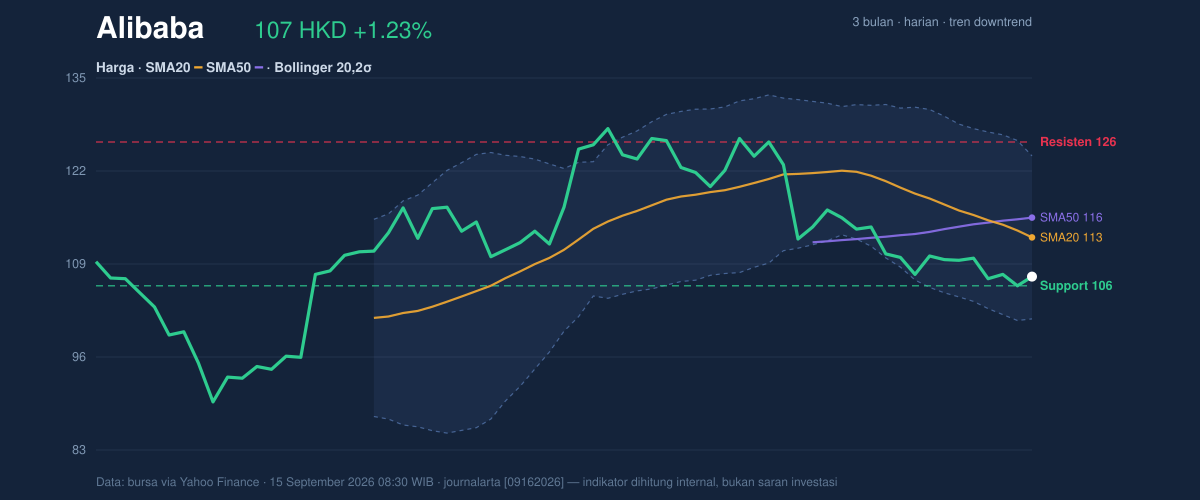
The Bollinger Bands add another layer. Price is sitting well below the middle band at HKD 112.73, with %B at 26%, which means the stock is trading closer to the lower band than the upper band. In practical terms, that often reflects weak momentum and limited buying conviction, even if the stock is not yet at an extreme. The band width at 20.4% is widening, and that usually tells traders the market is becoming more volatile rather than settling into a calm range.
A dense signal set, but the message is not subtle: the trend is still down, and the rebound has not yet proven it can stand on its own.
Oscillators & Momentum
Momentum indicators are mixed, but they do not yet show a full reversal. The RSI(14) at 39.2 is technically neutral, but it sits below the midpoint that often separates positive from negative momentum. That means the stock is not oversold enough to scream exhaustion, yet not strong enough to confirm a durable recovery either. By contrast, the Stochastic %K at 19.7 and %D at 16.7 are in oversold territory, which can hint that near-term downside may be stretched. Still, oversold does not automatically mean a bounce will hold; it only means the stock has been sold hard enough to look compressed.
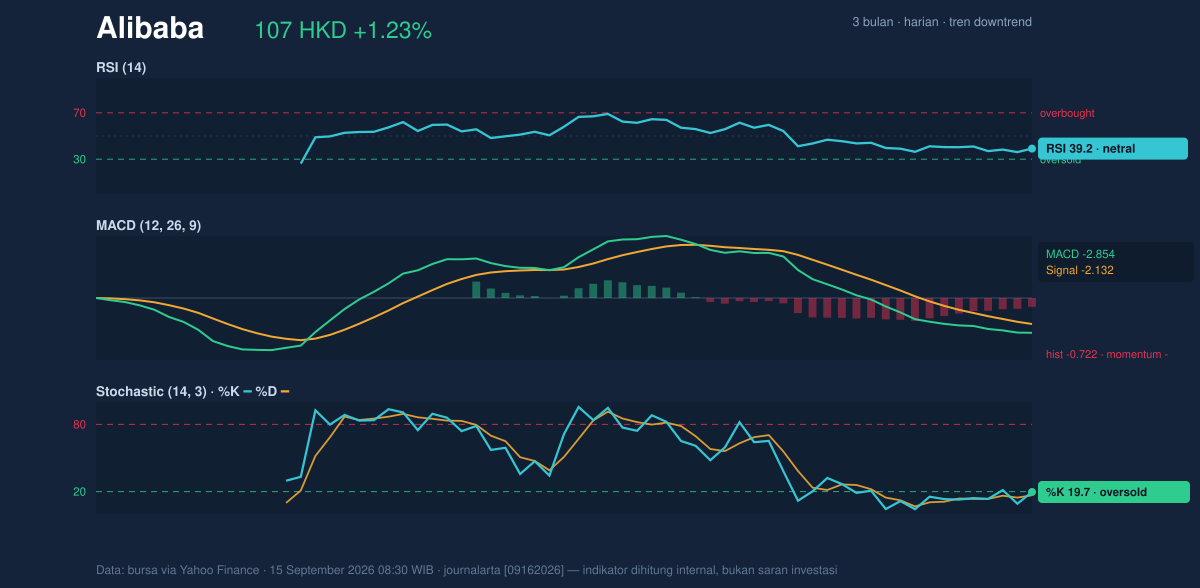
The more decisive signal comes from MACD. With MACD at -2.854, below the signal line at -2.132, and a histogram of -0.722, momentum remains negative. The histogram is the gap between MACD and its signal line; when it is below zero, the trend is losing energy rather than building it. So while Stochastic suggests the stock may be stretched, MACD says the broader momentum still points down. That combination often produces choppy trading: sharp rebounds that struggle to follow through.
Volatility & Volume
The ATR(14) of 3.23, equal to about 3.0% of price, suggests movement is still active enough to matter, but not chaotic. ATR measures the average daily trading range, so a reading like this means the stock can still swing meaningfully without needing a major headline. The widening Bollinger bands reinforce that view: the market is not settled, and price discovery is still underway.
Volume, however, is the weak link. Last session’s turnover of 47,161,376 was only about 0.5x the 20-day average of 93,419,050, and OBV is falling. OBV, or on-balance volume, tracks whether volume is flowing into or out of a stock; a declining OBV means volume has been accompanying the down move more than the up move. That matters because a price bounce on light participation is easier to fade. The market can lift on thin trading, but it usually needs stronger volume to build a lasting base.
Key Levels & Scenarios
The nearest support is HKD 105.90, with the lower Bollinger band at HKD 101.22 acting as the next technical cushion if that level gives way. On the upside, resistance sits at HKD 126.20, which is also the 20-day high in the supplied data. The stock is currently near the bottom of its 3-month range, with a high of HKD 130.30 and a low of HKD 88.65, so the broader range is wide enough to allow large swings, but the present setup still favors caution.
If price can reclaim the SMA20 at HKD 112.73 and then push through the SMA50 at HKD 115.52, that would begin to ease the pressure from the death cross and suggest the recent rebound has more staying power. If it fails to hold HKD 105.90, the chart points toward a test of the HKD 101.22 lower band, where volatility may intensify.
Technical Verdict: HOLD (wait & see)
HOLD (wait & see) — because the stock has bounced, but the broader technical structure is still weak.
- Death cross and price below SMA20 and SMA50 keep the trend bearish.
- MACD remains negative, showing momentum has not yet turned.
- Stochastic is oversold, which supports a rebound attempt, but volume is only 0.5x average and OBV is declining, so participation is not confirming strength.
Verdict invalidated if price falls below HKD 105.90.
- Ideal Entry Range: HKD 105.90 to HKD 112.73
- Exit Target (Target Price): HKD 115.52 to HKD 126.20
- Stop Loss protection: below HKD 101.22
In plain English: the chart is asking for proof before trust.
As of 15 September 2026 08:30 WIB, Alibaba’s Hong Kong shares last traded at HKD 107.20.
Summary Data Alibaba
| Last price | 107.20 HKD |
| Change 1 day / 5 days / 1 month | 1.23% / -2.10% / -15.39% |
| Trend / MA-cross | downtrend / death |
| SMA20 / SMA50 | 112.73 / 115.52 |
| RSI (14) / Stochastic %K | 39.2 / 19.7 |
| Bollinger %B / ATR | 26% / 3.23 |
| Support / Resistance 20 days | 105.90 / 126.20 |
| Data as of | 15 September 2026 08:30 WIB |



