DBS Momentum Weakens: Stock Drops 0.32% (September 16, 2026)
On September 16, 2026: price 76.75 SGD, trend sideways, RSI 59.0, support 75.56, resistance 78.65. technical analysis of dbs stock. DBS Momentum Weakens — full…

DBS Group’s shares slipped to SGD 76.75 on SGX, down 0.32% from the previous close, with the stock now sitting just below its SMA20 at SGD 76.88 even as the broader setup remains range-bound, according to data from Yahoo Finance via the exchange. The message from the tape is not dramatic, but it is telling: DBS is still trading in the upper half of its recent band, yet the latest move shows buyers have not been able to extend control beyond the short-term average. That matters because when a large bank stock hovers near its moving average without breaking away, it often signals a market waiting for a fresh catalyst rather than one already in motion.
Trend & Price Action
The longer lens is still constructive, but only modestly so. DBS is described as sideways, with the SMA20 slope at 0.35% over 5 days, which points to a market that is drifting higher rather than trending decisively. The stock remains above its SMA50 at SGD 74.72, a sign that medium-term structure is still intact, but the fact that price is below the SMA20 shows short-term momentum has softened. In plain English: the share price is neither breaking down nor breaking out; it is pausing after a recent stretch of mild weakness.
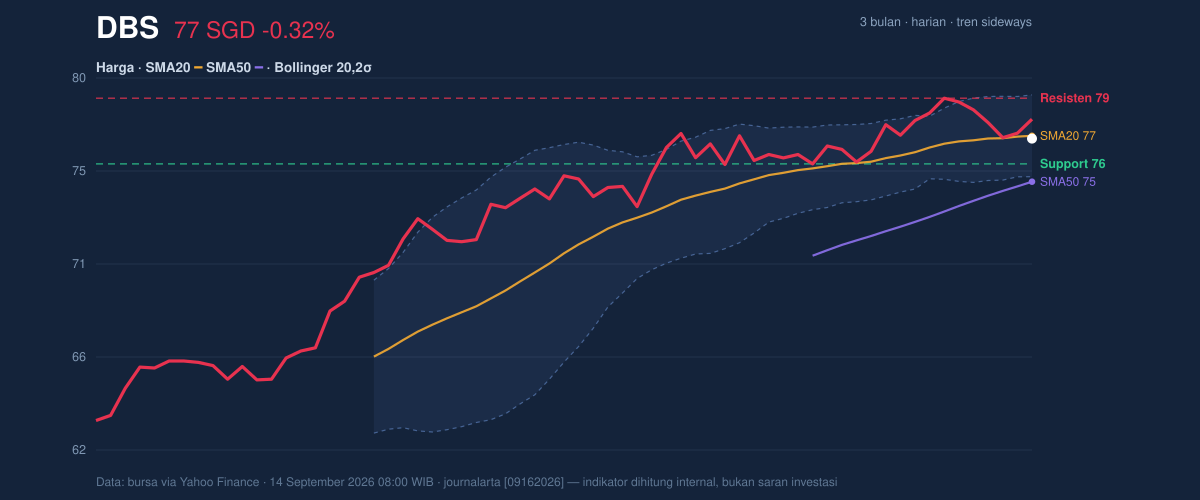
The Bollinger Bands add an important layer to that picture. With the middle band also at SGD 76.88, DBS is effectively testing the center of its recent trading corridor. The upper band sits at SGD 78.80 and the lower band at SGD 74.96, while the band width has narrowed to 5.0%. That kind of squeeze usually means volatility has been compressed and the next meaningful move could be sharper than the recent day-to-day drift. The stock is positioned at 39% of its 20-hour range, which is not weak enough to imply panic, but low enough to show sellers have had the upper hand in the latest session.
The short-term reference points are clear: support at SGD 75.56 and resistance at SGD 78.65. That is the channel the market is respecting for now.
Oscillators & Momentum
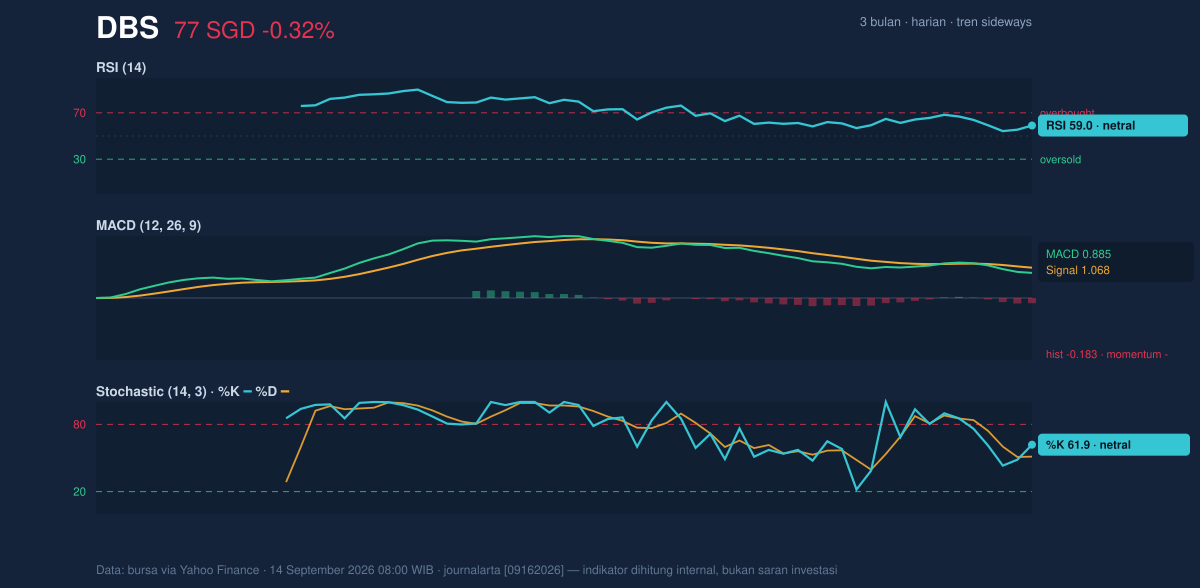
Momentum is mixed rather than aligned. The RSI at 59.0 is neutral, which means DBS is not stretched into overbought territory and still has room to move either way. The Stochastic %K at 61.9 and %D at 51.2 also sit in neutral ground, showing some upward lift but not enough to call it a strong reversal signal. In other words, the oscillators are not flashing alarm bells; they are simply saying the stock is mid-range, with no clear conviction.
The more cautionary signal comes from the MACD. At 0.885, it remains positive in absolute terms, but it is below the signal line at 1.068, leaving a histogram of -0.183. That negative histogram is the key detail: it means the shorter-term trend has lost some pace relative to the longer-term trend. This is often how a stock transitions from a steady climb into a consolidation phase. It does not imply a breakdown by itself, but it does mean buyers are no longer accelerating the move.
Volatility & Volume
DBS is trading with ATR(14) at 0.86, or 1.1% of price, which indicates low volatility. For a bank stock of this size, that usually reflects steady participation rather than fear-driven swings. But low volatility can cut both ways: it can keep the stock orderly, yet it also means any breakout or breakdown from the current band may need a stronger catalyst to stick.
Volume is not helping the bullish case. The latest turnover of 2,787,100 was only 0.8x normal versus the 20-hour average of 3,455,700, and OBV is falling. OBV, or on-balance volume, tracks whether volume is flowing into the stock on up days or out of it on down days. A declining OBV suggests that recent trading has been more distribution than accumulation, which weakens the odds of an immediate upside push. Put simply: price is holding, but participation is thinning.
Key Levels & Scenarios
The chart structure, as shown in the price action setup, gives the market a narrow map. If DBS can recover and hold above SGD 76.88, the SGD 78.65 to SGD 78.80 zone becomes the obvious ceiling to watch. That area matters because it combines the stated resistance with the upper Bollinger Band, often a place where rallies either pause or prove they have real strength. If price fails to defend SGD 75.56, the next technical reference is the SGD 74.96 lower Bollinger Band, which would signal the squeeze is resolving to the downside rather than into a breakout.
The broader 3-month range also frames the story. DBS has traded between SGD 63.08 and SGD 79.05 over that period, so the current level remains close to the upper end of the range. That is supportive, but only if the stock can stop slipping back toward the middle of the band.
Technical Verdict: HOLD (wait & see)
HOLD (wait & see)
- RSI 59.0 and Stochastic 61.9/51.2 are neutral, so momentum is not strong enough to confirm a new leg higher.
- MACD histogram -0.183 shows the short-term trend is losing pace, while volume at 0.8x normal and OBV falling suggest weak participation.
- Price below SMA20 at SGD 76.88 but above SMA50 at SGD 74.72 leaves DBS in an in-between zone, reinforced by the 5.0% Bollinger squeeze.
- Invalidation: this verdict weakens if price falls below SGD 75.56, because that would break the nearest support and open the door toward the SGD 74.96 lower band.
- Ideal Entry Range: SGD 75.56 to SGD 76.88
- Exit Target: SGD 78.65 to SGD 78.80
- Stop Loss protection: below SGD 74.96
For non-traders: DBS is still holding its ground, but the chart says the market is waiting for proof before choosing a direction.
"Right now, this is a stock that is holding its breath."
Summary Data DBS
| Last price | 76.75 SGD |
| Change 1 day / 5 days / 1 month | -0.32% / -2.19% / -0.17% |
| Trend / MA-cross | sideways / none |
| SMA20 / SMA50 | 76.88 / 74.72 |
| RSI (14) / Stochastic %K | 59.0 / 61.9 |
| Bollinger %B / ATR | 47% / 0.86 |
| Support / Resistance 20 days | 75.56 / 78.65 |
| Data as of | 14 September 2026 08:00 WIB |



