HSBC Stock Analysis: Drops 3.21%, Testing Support Level
On September 16, 2026: price 159.60 HKD, trend sideways, RSI 43.2, support 159.60, resistance 167.60. technical analysis of hsbc stock.

HSBC Holdings fell to HK$159.60, down 3.21% from the previous close of HK$164.90 as of 15 September 2026, with the stock now sitting at the very bottom of its 20-day trading range. The move matters less as a one-day drop than as a test of whether buyers can defend the lower edge of a range that has been compressing for several sessions. As shown in the chart, the price is trading below the SMA20 at HK$162.97 and only slightly below the SMA50 at HK$161.28, a setup that says the stock is not trending strongly in either direction but is vulnerable to a short-term break if support gives way.
Trend & Price Action
The broader structure is still labeled sideways, and the key detail is that the SMA20 slope is only 0.24% over 5 days. That is a mild upward tilt, but not enough to call it a firm uptrend. In plain terms, the stock has been drifting rather than committing. The absence of a new MA-cross also matters: when the faster average does not decisively cross the slower one, it usually signals that the market has not yet chosen a clean direction.
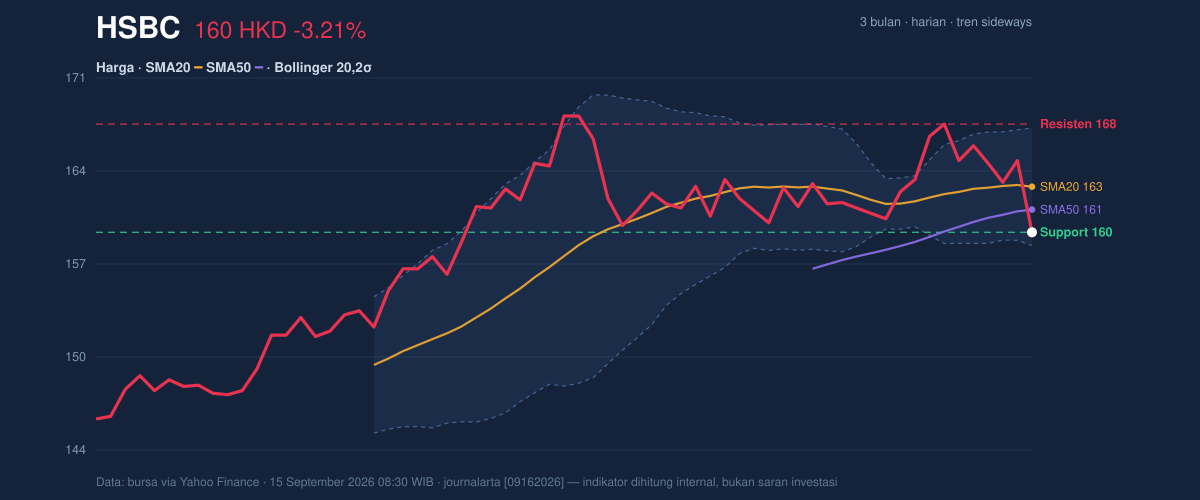
The price is also positioned at 0% of the 20-hour range, with support at HK$159.60 and resistance at HK$167.60. That means the latest print is not just near support — it is sitting on it. The nearby 3-month band from HK$143.40 to HK$169.70 frames the move: HSBC is trading in the upper half of that longer range, but it is no longer pressing the highs. That combination often tells traders the market is consolidating, not breaking out.
A narrow range can stay narrow only until it cannot.
Oscillators & Momentum
The momentum picture is mixed, and the tension between indicators is the main story. RSI(14) at 43.2 is neutral, which means the stock is neither overbought nor oversold on a broad momentum basis. But the Stochastic %K at 8.8 versus %D at 41.8 is a much sharper signal: stochastic is in oversold territory, suggesting the latest price weakness has been fast enough to stretch short-term momentum to the downside.
That does not automatically mean a rebound is imminent. The MACD at 0.743 remains above zero, but it is below the signal line at 1.115, leaving a -0.372 histogram. In chart terms, that means the longer trend is not broken, but the recent pace has weakened. MACD is often read as a trend-following measure, so when it stays positive but slips under its signal line, it usually points to fading upside pressure rather than a clean reversal.
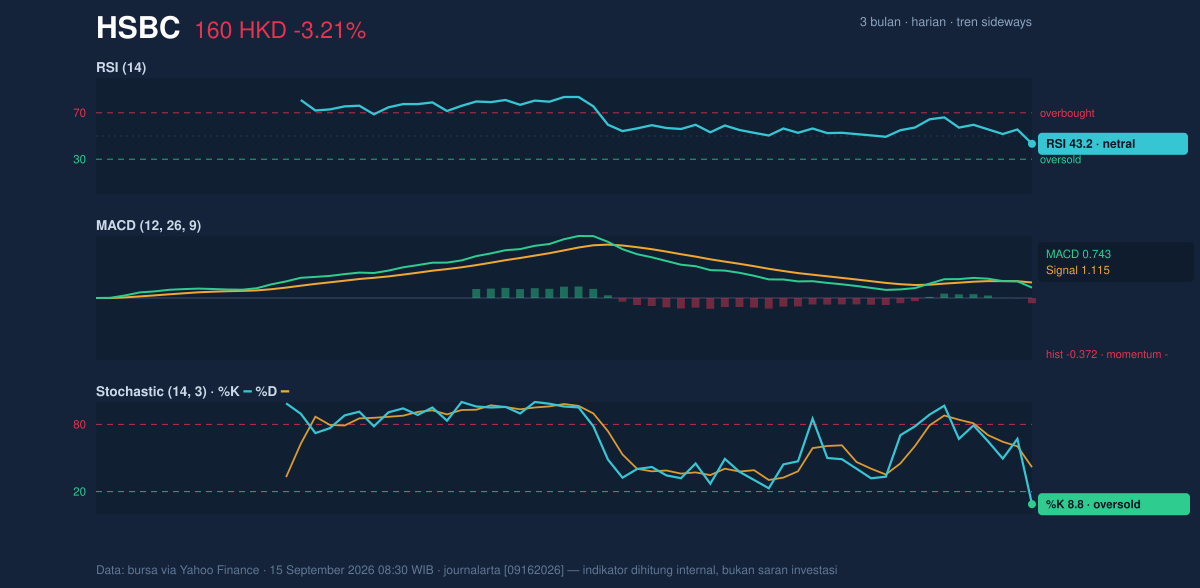
The takeaway is that the stock has short-term oversold conditions, but the broader momentum engine is still cooling rather than reversing. That is a setup for volatility, not certainty.
Volatility & Volume
Bollinger Bands are telling a useful story here. With the upper band at HK$167.31, the middle band at HK$162.97, and the lower band at HK$158.63, HSBC is trading close to the lower edge, with %B at 11%. In simple language, %B measures where price sits within the band structure; 11% means the stock is hugging the bottom of the recent volatility envelope. That often reflects pressure, but it can also precede a snapback if sellers exhaust themselves.
The more important twist is that the band width is only 5.3% and is described as squeezing. A squeeze means volatility has contracted, which often comes before a sharper move. It does not say which direction that move will take, but it does say the market is storing energy.
Volume adds credibility to the move lower. Last volume was 14,661,444, above the 20-session average of 10,390,931, or about 1.4× normal. That tells us the selloff was not happening in thin, ignored trading. The rise in OBV is the counterpoint: on-balance volume tracks whether volume is accumulating on up days or down days, and a rising OBV suggests underlying participation has not fully turned against the stock. Put together, the message is that selling pressure is real, but the longer-term volume balance has not completely broken.
Key Levels & Scenarios
The immediate battleground is tight. HK$159.60 is both the latest price and the 20-hour support line, so the market is testing its own floor. Above that, HK$161.28 and HK$162.97 are the first and second technical recovery markers, while HK$167.60 is the near-term ceiling. The lower Bollinger band at HK$158.63 is especially important because it sits just beneath current price; a decisive move below it would confirm that the squeeze is resolving to the downside.
If price can reclaim HK$162.97, the middle Bollinger band, it would suggest the market is re-entering the center of its recent range. If it can then press toward HK$167.31 to HK$167.60, the chart would start to look like a recovery from oversold conditions rather than a continuation of weakness. If instead HK$159.60 fails to hold, the next signal would be that the squeeze is breaking with downside momentum, not stabilizing.
Technical Verdict: HOLD (wait & see)
HOLD (wait & see) fits the chart because the stock is caught between short-term oversold pressure and a broader sideways structure.
- Stochastic is oversold, which can support a reflex bounce, but it has not been confirmed by MACD.
- Price is below SMA20 and just below SMA50, so the trend is not strong enough to call a clean recovery.
- Bollinger Bands are squeezing, which warns of a larger move ahead, but direction is still unresolved.
Verdict invalidated if price breaks below HK$158.63, the lower Bollinger band and nearest technical floor.
- Ideal Entry Range: HK$158.63 to HK$161.28
- Exit Target: HK$162.97 to HK$167.31
- Stop Loss protection: below HK$158.63
For non-traders: the chart says HSBC is compressed near support, but it has not yet shown enough strength to prove the next move is higher.
The next technical marker is HK$158.63, the lower Bollinger band.
Summary Data HSBC
| Last price | 159.60 HKD |
| Change 1 day / 5 days / 1 month | -3.21% / -3.21% / -1.54% |
| Trend / MA-cross | sideways / none |
| SMA20 / SMA50 | 162.97 / 161.28 |
| RSI (14) / Stochastic %K | 43.2 / 8.8 |
| Bollinger %B / ATR | 11% / 2.54 |
| Support / Resistance 20 days | 159.60 / 167.60 |
| Data as of | 15 September 2026 08:30 WIB |



