AIA Stock Gains 0.80%, Golden Cross Formed In Focus
On September 16, 2026: price 76.05 HKD, trend uptrend, RSI 52.5, support 72.75, resistance 77.50. technical analysis of aia stock. AIA Stock Gains — full…

AIA Group edged up to 76.05 HKD as of 15 September 2026 08:30 WIB, rising 0.80% on the day and holding above both its short- and medium-term averages. The move matters less for the size than for the structure behind it: the stock is still in an uptrend, the SMA20 has crossed above the SMA50 in a golden cross, and price remains above the 20-day average. That combination usually signals that recent buyers are still in control, even if the latest momentum is not fully confirming the advance.
Trend & Price Action
The chart shows AIA trading in the upper part of its recent range, at about 69% of the 20-hour band, with the latest price sitting between support at 72.75 HKD and resistance at 77.50 HKD. That placement is important because it suggests the market has not broken out decisively, but neither has it slipped back into weakness. The stock is also above the SMA20 at 75.50 and the SMA50 at 75.46, a narrow gap that tells readers the trend is positive but still delicate. When moving averages sit close together and price stays above them, the message is usually one of consolidation inside an existing rise rather than a runaway advance.
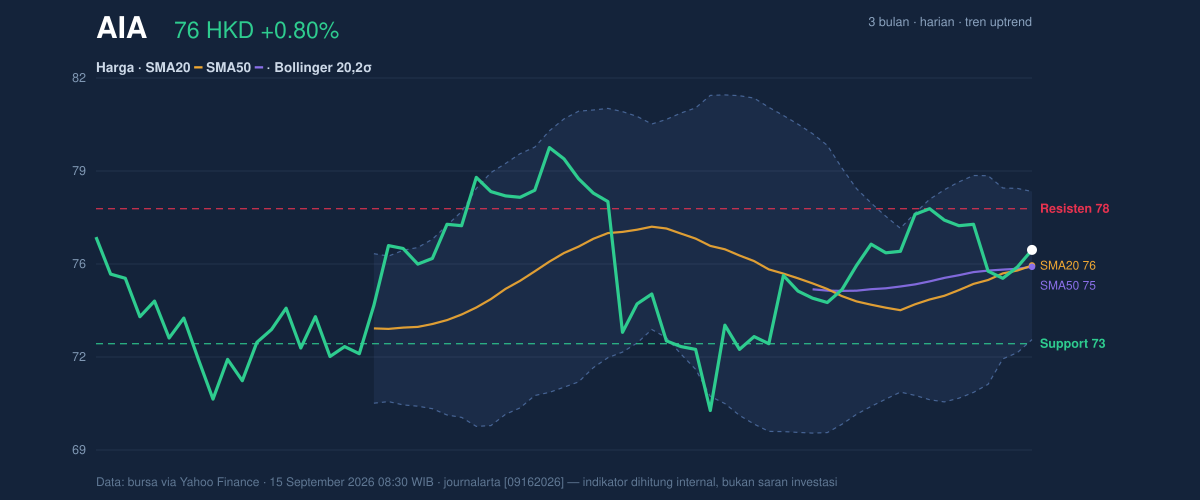
The golden cross is the cleaner trend signal here. In plain terms, the shorter average moving above the longer one often reflects improving medium-term sentiment, because recent prices have been strong enough to pull the trend line higher. But the market has not yet escaped its nearby ceiling. The 3-month high at 80.15 remains the broader upside reference, while 69.35 marks the lower boundary of the recent 3-month range.
Oscillators & Momentum
The momentum picture is more restrained than the trend picture. RSI at 52.5 is neutral, which means the stock is neither stretched nor washed out. Stochastic %K at 50.5 and %D at 39.6 are also neutral, showing that price is not in an obvious overbought or oversold condition. That matters because it leaves room for either direction, depending on whether buyers can keep pressing against resistance or whether the stock loses traction.
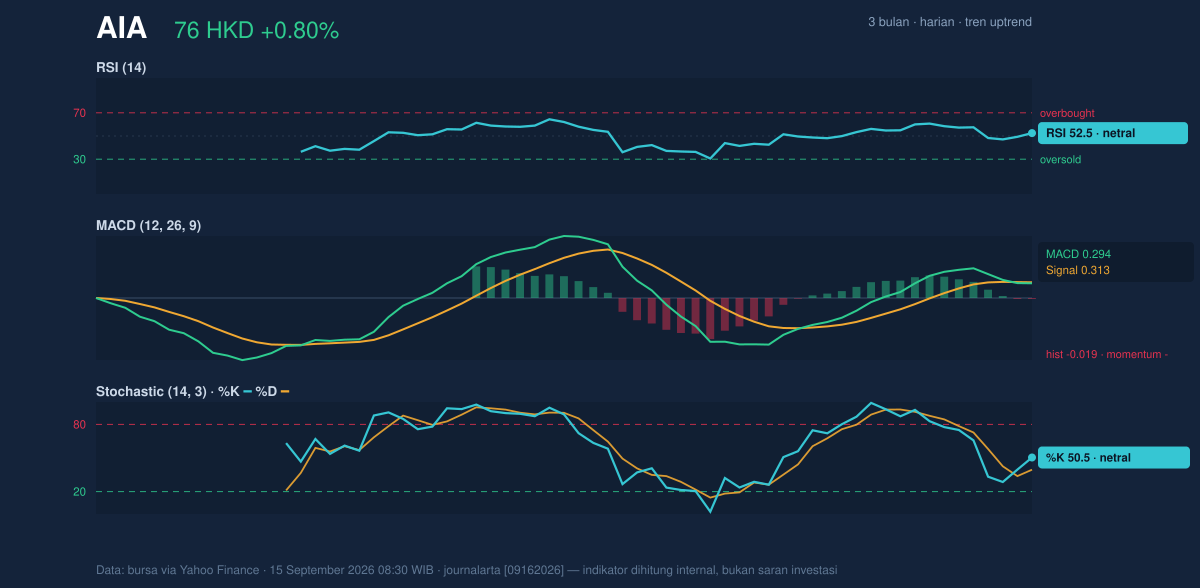
The caution flag comes from MACD. MACD at 0.294 sits below the signal line at 0.313, with a histogram of -0.019. That small negative reading means the shorter-term pace of gains has cooled relative to the underlying trend. In simple language: the chart still leans upward, but the push is not accelerating. When MACD turns negative while price remains above moving averages, it often points to a market that is pausing rather than reversing outright.
Volatility & Volume
Volatility is moderate, not extreme. ATR at 1.59, or 2.1% of price, suggests the stock can move enough to matter intraday, but not so violently that every session resets the picture. The Bollinger Bands reinforce that sense of compression. Price is near the middle of the band at %B 61%, with the upper band at 78.10 and the lower band at 72.90. More importantly, the 6.9% band width is narrowing, which often signals a squeeze. A squeeze does not predict direction on its own, but it does tell traders that the market is storing energy and may be preparing for a larger move once a boundary gives way.
Volume offers quiet confirmation rather than a dramatic signal. The latest volume of 26,778,954 is almost exactly in line with the 20-hour average of 26,870,471, or 1.0x normal. That means the day’s advance was not driven by a surge of participation. Still, OBV is rising, which is constructive because on-balance volume tracks whether trading flow is accumulating behind price. In other words, the tape is not shouting, but it is leaning in the right direction.
Key Levels & Scenarios
The market is boxed between nearby support and resistance, and that box is likely to define the next phase. A move through 77.50 HKD resistance would strengthen the case that the squeeze is resolving upward, especially if volume expands beyond the recent norm. Failure to hold 75.50 would weaken the current trend structure because that level is also the SMA20 and the Bollinger midline, both of which act as short-term trend guides. A break below 72.75 support would be more serious, because it would shift the stock back toward the lower band at 72.90 and raise the risk that the recent uptrend is losing its base.
The key signal to watch is whether price can turn a neutral momentum backdrop into a confirmed push. Right now, the market is not overextended, which is constructive. But with MACD still negative and volume only average, the chart is asking for confirmation rather than assuming it.
Technical Verdict: HOLD (wait & see)
HOLD (wait & see)
- Golden cross and price above both SMA20 at 75.50 and SMA50 at 75.46 keep the trend constructive.
- MACD at 0.294 below signal at 0.313 shows momentum is not yet fully aligned with the uptrend.
- Bollinger Band width at 6.9% suggests a squeeze, so the next meaningful move may come after a break of range.
- Invalidation: this verdict weakens if price falls below 72.75 HKD support.
- Ideal Entry Range: 75.50 to 76.05 HKD
- Exit Target: 77.50 HKD, with 80.15 HKD as the broader range high
- Stop Loss protection: below 72.75 HKD
In plain English, AIA is still trending higher, but the chart is waiting for proof that the next push has real strength behind it.
The latest 3-month high is 80.15 HKD.
Summary Data AIA
| Last price | 76.05 HKD |
| Change 1 day / 5 days / 1 month | 0.80% / -1.11% / 4.82% |
| Trend / MA-cross | uptrend / golden |
| SMA20 / SMA50 | 75.50 / 75.46 |
| RSI (14) / Stochastic %K | 52.5 / 50.5 |
| Bollinger %B / ATR | 61% / 1.59 |
| Support / Resistance 20 days | 72.75 / 77.50 |
| Data as of | 15 September 2026 08:30 WIB |



