Tencent Stock Technicals Today: Gains 1.90%, Momentum Weakens
On September 16, 2026: price 438.80 HKD, trend downtrend, RSI 46.7, support 425.60, resistance 457.00. technical analysis of tencent stock.

Tencent Holdings rose to HK$438.80 on the Hong Kong exchange on 15 September 2026, recovering from a previous close of HK$430.60 even as the broader technical picture still points to a downtrend. The move matters less for the size of the gain than for where it landed: the shares are still below the 20-day moving average at HK$441.28 and well under the 50-day moving average at HK$455.10, which means the rebound has not yet reversed the heavier pressure that has been building over the past month. In plain terms, Tencent is bouncing, but it is still trading inside a range where sellers have had the upper hand.
Trend & Price Action
The chart shows a stock that is trying to stabilize without yet regaining control of the trend. Tencent’s HK$438.80 close sits just under the Bollinger middle band at HK$441.28, a line that often acts like a balance point between short-term strength and weakness. That positioning is important because the SMA20 slope of -0.83% over 5 days signals that the short-term trend is still tilting lower, even after the day’s gain. With no fresh moving-average crossover, there is no technical evidence yet of a trend reversal — only a pause in the decline. The share price is also sitting around the middle of the 20-hour range, at 42% of that band, which suggests the market is not pressing aggressively in either direction right now.
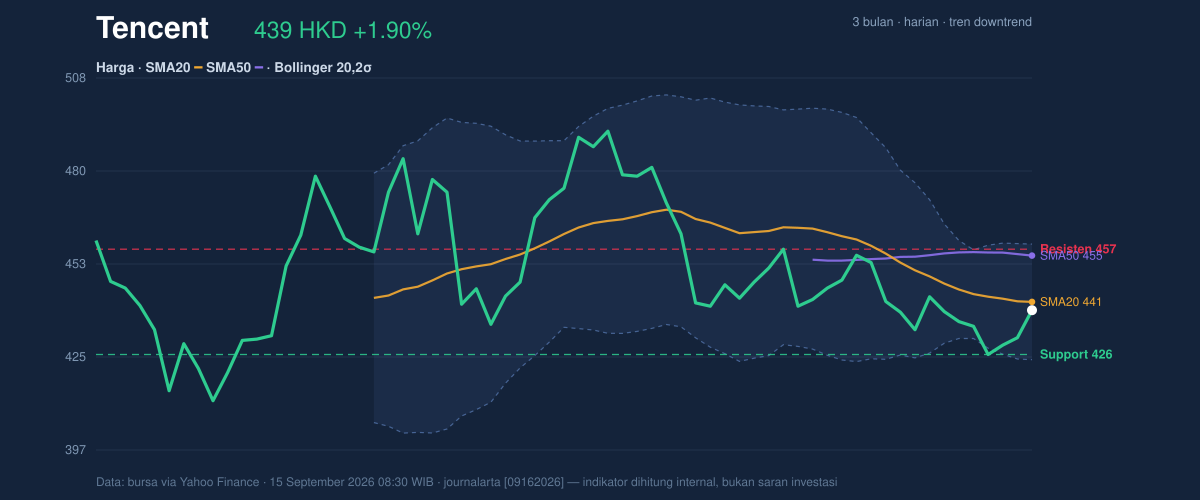
The longer lens is still mixed. Tencent is above the 3-month low of HK$411.00, so the recent pullback has not turned into a breakdown of the wider range. But it is also far below the 3-month high of HK$497.80, which shows how much ground remains to recover before the chart would look constructive again. The key message from the price structure is simple: the stock is no longer falling in a straight line, but it has not yet climbed back into a clearly bullish posture.
Oscillators & Momentum
The momentum gauges are neutral on the surface but still lean negative underneath. Tencent’s RSI at 46.7 sits in neutral territory, meaning the stock is neither stretched on the upside nor washed out on the downside. That matters because it leaves room for a move in either direction, but it does not itself confirm a reversal. The Stochastic reading of 45.3 / 30.8 also points to a middle-of-the-road setup: there is no obvious overbought pressure, yet the indicator is not deep enough into oversold territory to argue for a strong technical rebound. In other words, momentum is not screaming “sell,” but it is also not giving the kind of clean turn that traders often want after a downtrend.
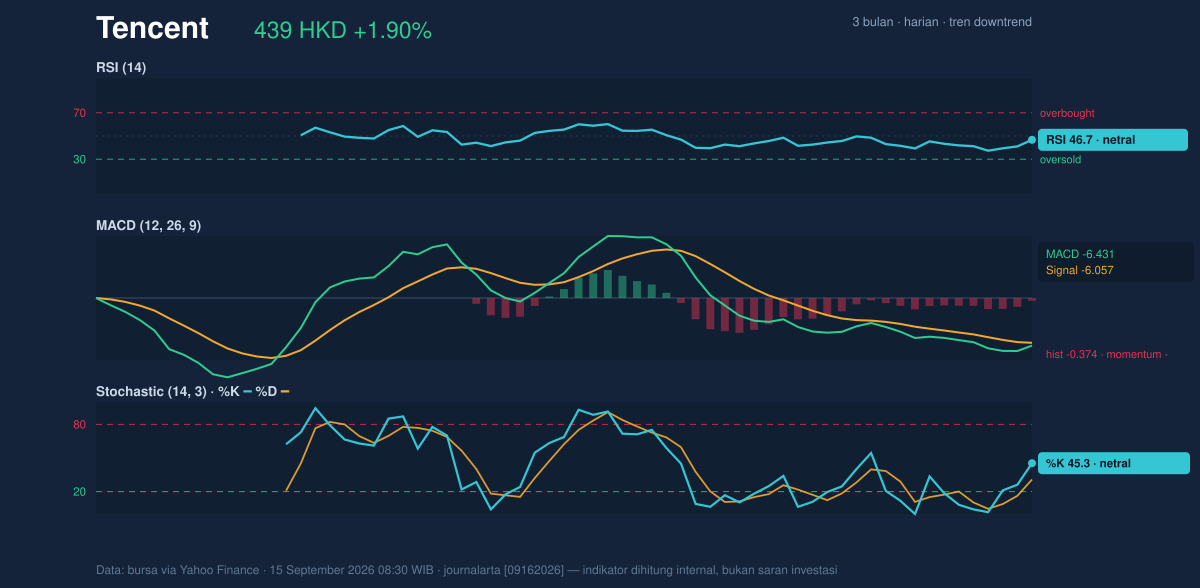
The more cautionary signal comes from MACD. Tencent’s MACD at -6.431 remains below its signal line at -6.057, with a negative histogram of -0.374. That configuration tells readers the recent price action is still losing momentum relative to the trend baseline. MACD is often used as a trend-following confirmation tool, and here it is confirming that the rally attempt has not yet overpowered the existing weakness. Put simply: the stock is trying to rise, but the momentum engine is still idling in reverse.
Volatility & Volume
The volatility setup is notable because it hints that the next move could be larger than the last few sessions have suggested. Bollinger Bands are narrowing to 7.8%, a classic squeeze pattern that often appears before a breakout or breakdown. With price near the middle band and the %B at 43%, Tencent is neither pressing the upper band nor testing the lower band. That tells us the market is compressed rather than decisive. The narrowing band also means the current calm may not last long.
Volume adds a useful layer of confirmation. Last trade volume of 21,791,117 was about 1.2 times the 20-hour average of 18,530,940, so the session was not a thin, low-conviction bounce. Yet OBV is falling, which is the more important message: on-balance volume tracks whether volume is supporting upward or downward moves, and a declining OBV suggests that the broader flow of capital has not fully embraced the rebound. That mismatch — slightly better turnover, but weakening volume trend — usually argues for caution rather than celebration. The ATR of 10.46, equal to 2.4% of price, also says the stock is still capable of meaningful intraday swings, so a breakout from the squeeze could travel quickly once it starts.
Key Levels & Scenarios
The chart gives a clear set of levels to watch. Immediate support at HK$425.60 sits close enough to matter, especially because it is below the current price but still within the recent trading band. On the upside, resistance at HK$457.00 aligns with the area where the stock would need to prove that the rebound is more than a one-day move. Between those two points, the Bollinger structure adds another reference: the lower band at HK$424.04 and upper band at HK$458.52 frame the likely volatility envelope if the squeeze releases.
If Tencent holds above HK$425.60 and can reclaim HK$441.28, the chart would look less fragile and more like a base-building attempt. If it slips below HK$424.04, the squeeze would start to resolve in a weaker direction, with the HK$411.00 three-month low back in focus. On the upside, a move through HK$457.00 would be the first sign that the market is challenging the heavier resistance zone and testing whether the downtrend is losing force.
Technical Verdict: HOLD (wait & see)
HOLD (wait & see) fits the current setup because the stock is rebounding, but the indicators are not yet aligned strongly enough to call a clean trend change.
- MACD remains negative, with the line below the signal line and a -0.374 histogram, showing momentum is still weak.
- Price is below the SMA20 at HK$441.28 and well under the SMA50 at HK$455.10, so the medium-term trend has not turned.
- Bollinger Bands are squeezing, which raises the odds of a sharp move, but the direction is not confirmed yet.
Verdict invalidated if price breaks below HK$424.04, because that would mean the lower Bollinger band has given way and the rebound has failed to hold.
- Ideal Entry Range: HK$425.60 to HK$441.28
- Exit Target: HK$457.00 to HK$458.52
- Stop Loss protection: below HK$424.04
For non-traders, this means Tencent is not broken, but it has not yet proved that the recent bounce is strong enough to change the story.
“The squeeze is real, and so is the tension — the next decisive move will tell us whether this is a pause or the start of something bigger.”
Summary Data Tencent
| Last price | 438.80 HKD |
| Change 1 day / 5 days / 1 month | 1.90% / 0.78% / -0.81% |
| Trend / MA-cross | downtrend / none |
| SMA20 / SMA50 | 441.28 / 455.10 |
| RSI (14) / Stochastic %K | 46.7 / 45.3 |
| Bollinger %B / ATR | 43% / 10.46 |
| Support / Resistance 20 days | 425.60 / 457.00 |
| Data as of | 15 September 2026 08:30 WIB |



