Singtel Stock Drops 1.11%, Testing Support Level In Focus
On September 16, 2026: price 4.45 SGD, trend sideways, RSI 48.7, support 4.40, resistance 4.56. technical analysis of singtel stock. Singtel Stock Drops — full…

Singapore Telecom (Singtel) on SGX fell to SGD 4.45 by 14 September 2026 08:00 WIB, down from the previous close of 4.50, as traders weighed a stock that is still moving sideways but has slipped below its short-term average. The share is not in a clean downtrend, yet the chart shows a market losing a little altitude while failing to reclaim the SMA20 at 4.49, which matters because that line often acts as the first test of whether buyers are regaining control.
Trend & Price Action
The broader structure remains sideways, and that is the key signal here: this is not a decisive breakdown, but neither is it a convincing recovery. The SMA20 is above price, while the SMA50 at 4.44 sits just below the last trade, leaving the stock pinned between short-term resistance and intermediate support. As shown in the chart, that positioning tells you the market is still undecided, with recent selling enough to cap momentum but not enough to force a clean trend change.
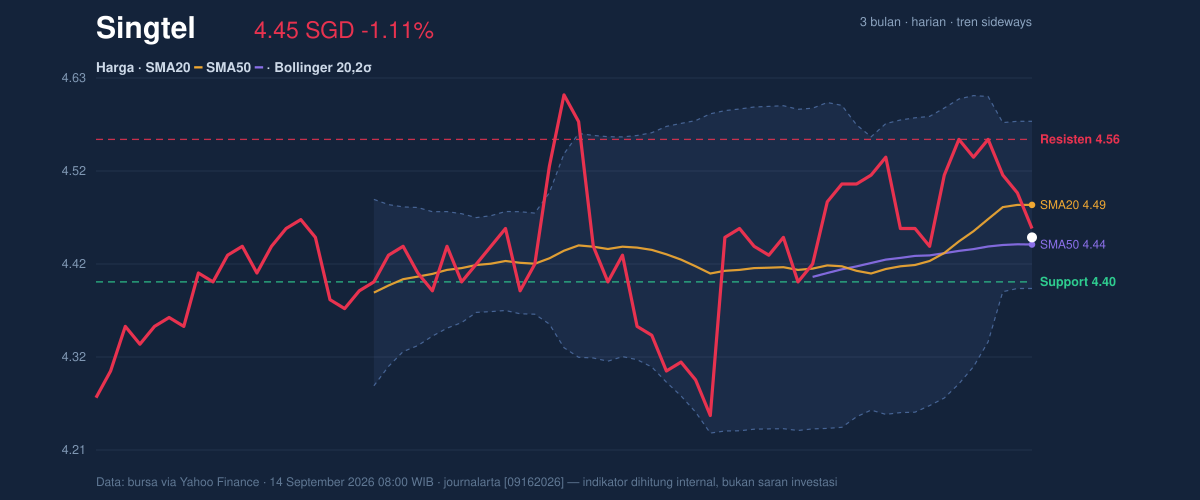
The price is also sitting in the lower third of its recent trading band, at 31% of the 20-hour range. That placement matters because it shows the stock is closer to support than resistance, but not yet at a level where bargain-style buying has clearly taken over. The 20-hour support at 4.40 and resistance at 4.56 frame the near-term battlefield, while the 3-month high of 4.70 and 3-month low of 4.19 define the wider range that traders are still respecting.
Oscillators & Momentum
Momentum is mixed, which is usually the most important clue in a sideways market. The RSI at 48.7 is neutral, meaning the stock is neither overbought nor oversold, while the Stochastic %K at 27.8 versus %D at 49.1 suggests short-term weakness has already pushed the share into the lower part of its recent momentum cycle. That gap is worth watching because Stochastic often turns before price does; here, it says the stock is stretched on the downside, but not yet reversing with conviction.
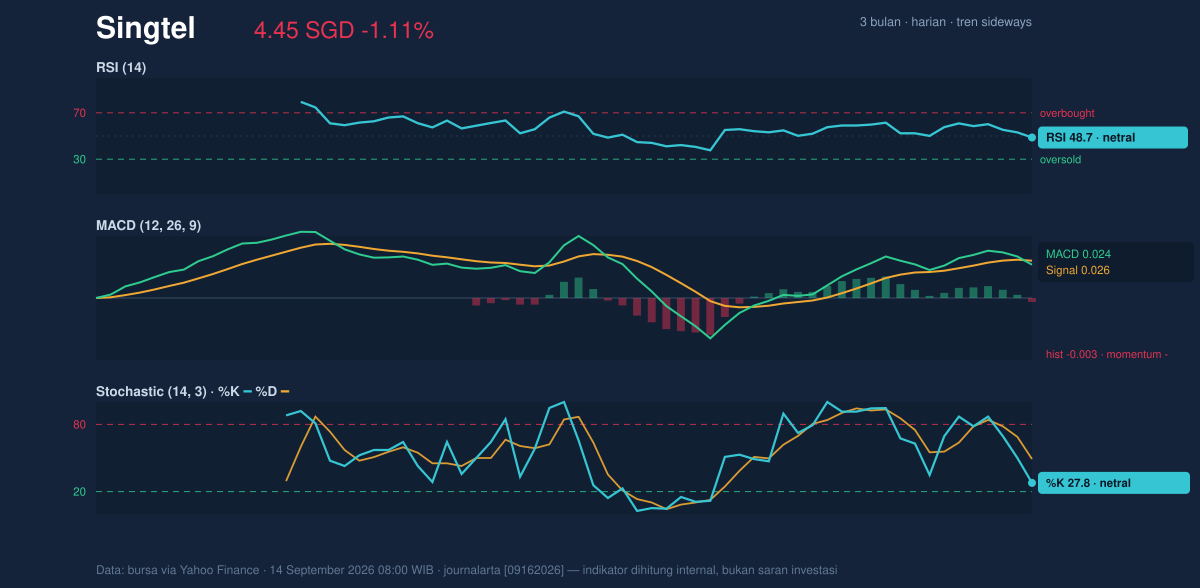
The MACD is 0.024 against a signal line of 0.026, with a histogram of -0.003. In plain English, that means the stock’s momentum is still slightly negative even though the gap is small, so the selling pressure is not strong, just persistent. When MACD hovers near zero like this, the market is often waiting for either a fresh catalyst or a break of a nearby level to decide direction.
Volatility & Volume
Volatility is moderate, with ATR(14) at 0.08, or 1.7% of price. That suggests the stock can move, but not violently, which is consistent with a large-cap telecom name trading in a compressed range. The more interesting signal is in the Bollinger Bands: the upper band is 4.58, the middle band is 4.49, and the lower band is 4.39, while the band width is 4.2% and is narrowing. A squeeze like this often precedes a larger move, but it does not tell you direction on its own; it simply says the stock is storing energy.
The %B at 31% shows price is trading in the lower portion of the Bollinger envelope, reinforcing the sense that buyers have not yet pushed the stock back toward the center of the range. Volume adds a slight nuance: last trade volume of 24,400,800 was 1.3× normal versus the 20-hour average of 19,244,783, but OBV is falling. That combination is important because heavier turnover without rising OBV usually means selling is still dominating the flow, even if the headline volume looks healthy.
Key Levels & Scenarios
The immediate support-resistance map is clear. 4.40 is the nearest support, and 4.56 is the nearest resistance. If the share can reclaim the SMA20 at 4.49 and then move through 4.56, the chart would begin to look less fragile, especially with the Bollinger squeeze suggesting a possible expansion in movement. If instead 4.40 gives way, the market would be vulnerable to a test of the lower end of the 3-month range near 4.19, because there is little technical cushioning between those points.
The current setup is therefore less about a strong trend and more about compression. The stock is trapped between a short-term average it cannot yet reclaim and a support zone that has so far held, while momentum remains soft enough to keep rallies cautious.
Technical Verdict: HOLD (wait & see)
HOLD (wait & see) because the chart is balanced between competing signals: price is below the SMA20, MACD is slightly negative, and OBV is falling, but the stock is still above SMA50 at 4.44 and the Bollinger Bands are squeezing, which raises the odds of a directional move without confirming which way it will go.
- Ideal entry range: 4.40 to 4.49, where support and the SMA20 cluster.
- Exit target: 4.56, with the upper Bollinger band at 4.58 as the next technical ceiling.
- Stop loss protection: below 4.40, since a break there would weaken the current range structure.
- Verdict invalidated if price breaks below 4.40, because that would expose the lower end of the 3-month range near 4.19.
For non-traders, this means the stock is not showing enough strength to chase, but it is also not weak enough to dismiss outright.
The latest known range still stands at 4.40 support and 4.56 resistance.
Summary Data Singtel
| Last price | 4.45 SGD |
| Change 1 day / 5 days / 1 month | -1.11% / -2.41% / -0.22% |
| Trend / MA-cross | sideways / none |
| SMA20 / SMA50 | 4.49 / 4.44 |
| RSI (14) / Stochastic %K | 48.7 / 27.8 |
| Bollinger %B / ATR | 31% / 0.08 |
| Support / Resistance 20 days | 4.40 / 4.56 |
| Data as of | 14 September 2026 08:00 WIB |



