OCBC Testing Support Level: Stock Drops 1.90% (September 16, 2026)
On September 16, 2026: price 31.00 SGD, trend sideways, RSI 61.8, support 30.78, resistance 32.27. technical analysis of ocbc stock. OCBC Testing Support Level…

OCBC Bank slipped to 31.00 SGD on SGX, down from 31.60 in the previous session, and the move matters because it left the counter below its 20-day average at 31.41 even as the broader structure remains only sideways. That combination usually signals a market that is not breaking down decisively, but is also not yet strong enough to reclaim short-term control. As shown in the chart, the stock is sitting in the lower part of its recent range, with a 20-hour support at 30.78 and 20-hour resistance at 32.27 shaping the next test.
Trend & Price Action
The price is trading below SMA20 but still well above SMA50 at 29.93, which is a useful signal for readers who want the simple translation: the medium-term trend has not turned weak, but the short-term tape has softened. There is no fresh moving-average crossover, so this is not a classic trend-reversal setup. Instead, the chart points to consolidation, with the SMA20 slope still slightly positive at 0.08% over five days, suggesting the recent drift is more of a pause than a collapse.
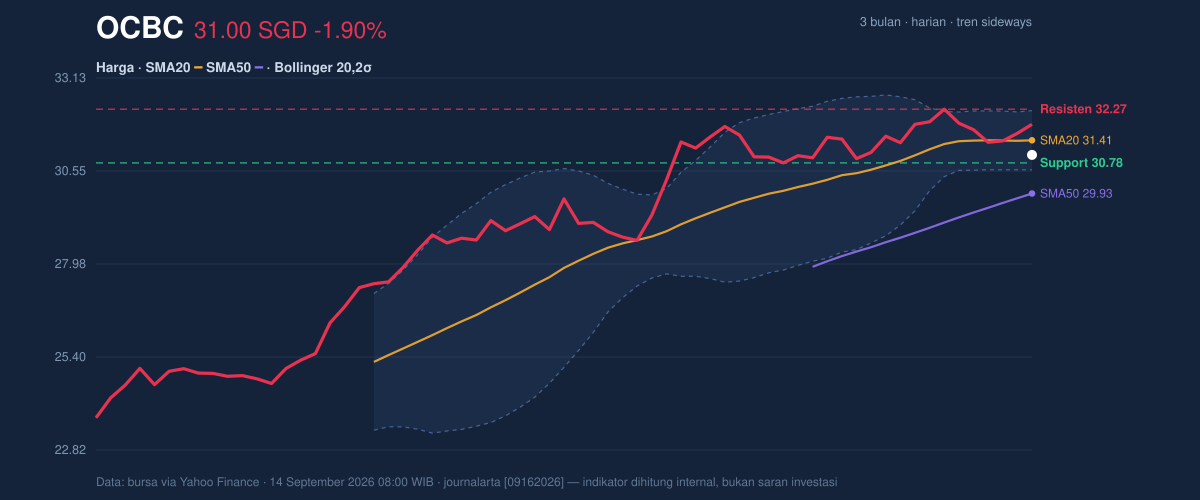
The position within the Bollinger band adds another layer. With the band’s middle line at 31.41, the stock is trading under the average but not far enough away to imply panic; the %B reading of 25% shows price is sitting in the lower quarter of the band, which often means the market is near the cheaper end of its recent trading envelope, not necessarily oversold in a technical sense. The more important clue is that the Bollinger band width is only 5.2%, a squeeze that often precedes a larger move. In plain language, the market is tightening, and tighter ranges tend to resolve with a sharper directional burst once buyers or sellers take control.
The broader range also frames the story. OCBC is still below its 3-month high of 32.57, but comfortably above the 3-month low of 23.71, so the chart is not showing a breakdown from the top of the range. It is showing a stock that has retreated from the upper end and is now trying to prove whether 30.78 can hold as a floor.
Oscillators & Momentum
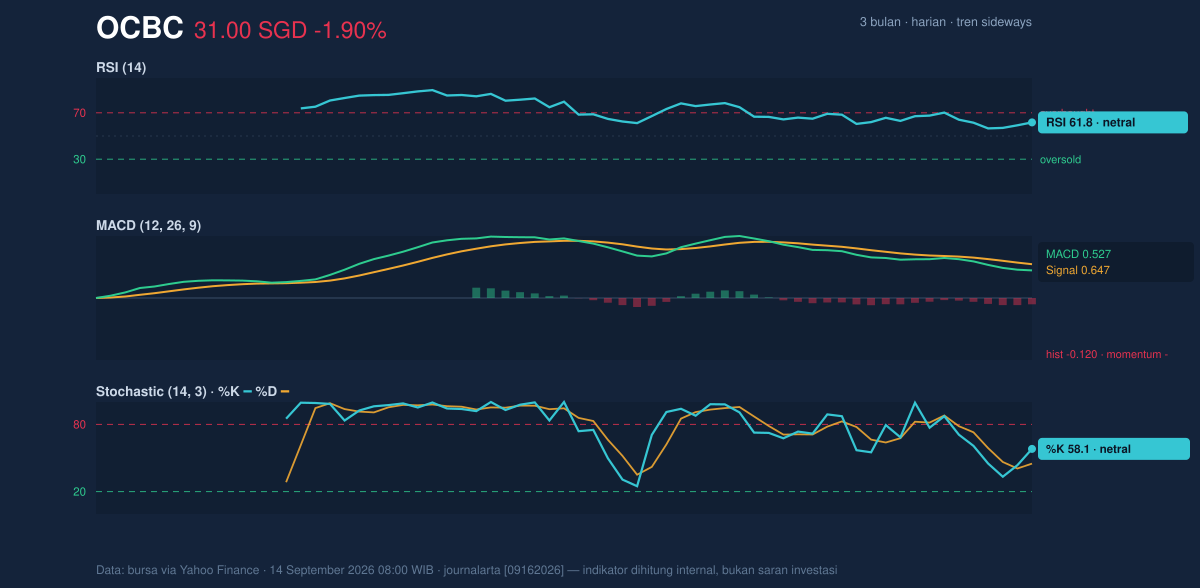
Momentum is mixed rather than decisive. The RSI at 61.8 is neutral, which means the stock is not in an overbought condition even after recent weakness, and there is still room for price to move either way without immediately triggering a momentum warning. The Stochastic %K at 58.1 and %D at 45.0 is also neutral, but the gap between the two lines shows short-term momentum has improved from the slower line without yet reaching an extreme. That is a mildly constructive setup, not a breakout signal.
The more cautionary signal comes from MACD. The MACD at 0.527 sits below the signal line at 0.647, and the histogram is -0.120, which means momentum is currently negative even though the broader trend has not broken. For general readers, that matters because MACD often turns before the price does; a negative histogram tells us the recent pace of gains has faded. In other words, the stock can still be range-bound or even firm, but the immediate push has lost some strength.
This is where the chart becomes more informative than any single indicator. RSI and Stochastic are not flashing stress, while MACD is still leaning lower. That divergence usually fits a market in transition, where sellers have eased but buyers have not yet forced a clean recovery.
Volatility & Volume
Volatility is moderate, with ATR(14) at 0.48, equal to about 1.5% of price. That suggests daily swings are present but not disorderly. Combined with the narrow Bollinger band, this points to a stock that may be preparing for a more meaningful move, though the direction is not yet confirmed.
Volume does not offer a dramatic confirmation either way. The latest turnover of 5,123,500 is close to the 20-day average of 5,372,715, or about 1.0x normal, so there is participation but not an obvious surge of conviction. Still, OBV is rising, which is a constructive sign because on-balance volume tracks whether money is generally flowing in or out. Rising OBV while price is slipping can sometimes mean accumulation is quietly continuing beneath the surface, even if the market has not yet rewarded it with a stronger price move.
Key Levels & Scenarios
The immediate battle is between 30.78 support and 32.27 resistance. The stock is currently near the lower end of that band, so the near-term question is whether buyers can defend the floor long enough to challenge the top of the range. If 30.78 gives way, the next technical message would be that the recent sideways pattern is failing and the market is likely to test lower levels closer to the moving-average zone. If 32.27 is reclaimed, the chart would shift toward a more constructive breakout attempt, helped by the squeeze in Bollinger bands.
The key point is that the stock is not in a trendless vacuum. It is compressed, with support, resistance, and a narrowing volatility band all pointing to a potential inflection. That is why the next move matters more than the last one.
Technical Verdict: HOLD (wait & see)
HOLD (wait & see)
- Reason 1: Price is below SMA20 at 31.41, showing short-term weakness.
- Reason 2: MACD is negative with the histogram at -0.120, so momentum has not turned up yet.
- Reason 3: The Bollinger squeeze at 5.2% width suggests a breakout may be coming, but direction is still unconfirmed.
- Verdict invalidated if price falls below 30.78 support, because that would weaken the current range structure.
- Ideal Entry Range: 30.78 to 31.00, where price is near support and inside the current lower band area.
- Exit Target: 32.27, the nearest resistance and the first level that would signal the range is being challenged.
- Stop Loss protection: Below 30.78, since a clean break under support would damage the current setup.
In plain English: OCBC is not showing enough upside confirmation yet, but it is also not showing a clear breakdown, so the chart is waiting for the next decisive move.
Summary Data OCBC
| Last price | 31.00 SGD |
| Change 1 day / 5 days / 1 month | -1.90% / -2.76% / -1.74% |
| Trend / MA-cross | sideways / none |
| SMA20 / SMA50 | 31.41 / 29.93 |
| RSI (14) / Stochastic %K | 61.8 / 58.1 |
| Bollinger %B / ATR | 25% / 0.48 |
| Support / Resistance 20 days | 30.78 / 32.27 |
| Data as of | 14 September 2026 08:00 WIB |



