Testing Support Level, Singtel Stock Drops 0.67% Today
On September 17, 2026: price 4.42 SGD, trend sideways, RSI 44.6, support 4.40, resistance 4.56. technical analysis of singtel stock. Testing Support Level —…

Singapore Telecommunications Ltd. slipped to 4.42 SGD on SGX on 16 September 2026, down from 4.45 the previous close, as the stock stayed pinned below its short-term average and near the lower edge of its recent range. The move is small in absolute terms, but the setup matters: Singtel is now trading in a market structure that looks more defensive than directional, with price action leaning on support while momentum indicators are mixed rather than decisively bullish or bearish.
Trend & Price Action
The chart shows a stock that is still in a sideways trend, not a clean downtrend, but one where buyers have lost some control. Singtel is below its SMA20 at 4.49, which means the latest price is trading under the short-term average that often acts as a first check on momentum. At the same time, the SMA50 at 4.44 sits just above the last price, so the medium-term average is acting like a nearby pivot rather than a strong barrier.
That positioning is important. When price sits below the 20-day average but near the 50-day line, the market is usually telling you it has not chosen a direction yet. The lack of a fresh MA-cross reinforces that message: there is no new moving-average signal to suggest a trend reversal or a trend acceleration. In plain terms, the stock is drifting inside a narrow decision zone.
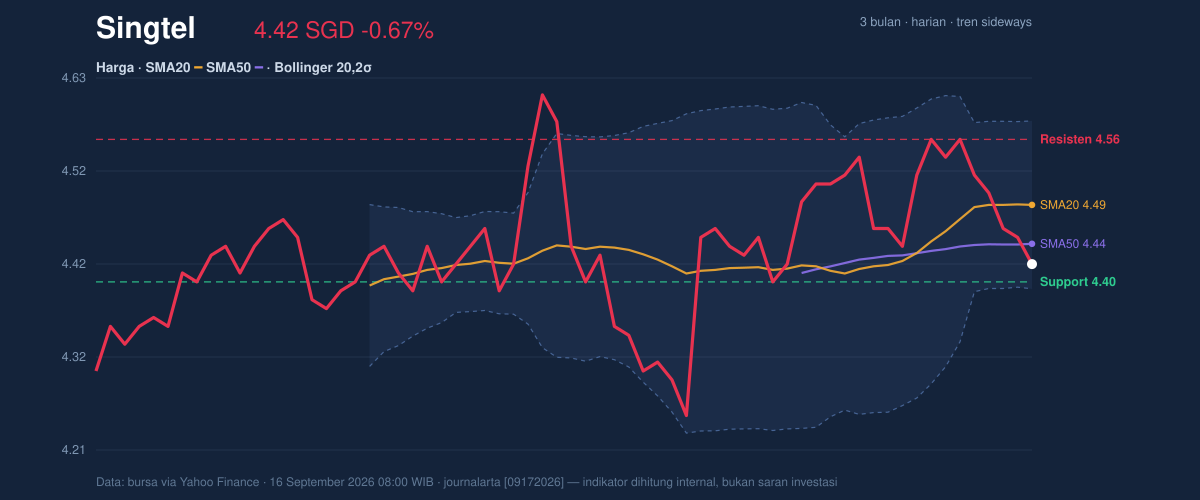
The range structure adds context. Singtel’s 20-hour support at 4.40 is only a little below the latest level, while 20-hour resistance at 4.56 caps the near-term upside. Price is sitting in the lower part of that band, at roughly the 12% range position, which means it is closer to the floor than the ceiling. The broader 3-month high of 4.70 and 3-month low of 4.19 show the stock is not collapsing, but it is also not reclaiming the upper half of its recent trading corridor.
Oscillators & Momentum
Momentum is where the picture becomes more nuanced. The RSI(14) at 44.6 is neutral, which says the stock is neither overbought nor oversold on a standard momentum gauge. That matters because a neutral RSI near support often signals a market waiting for a catalyst rather than one already in motion.
The Stochastic %K at 15.0 and %D at 21.7 are more compressed and point to oversold conditions. Stochastic measures where price sits within its recent range, so this reading suggests Singtel has been pushed toward the lower end of that range and may be due for a rebound attempt. But oversold does not mean reversal by itself; it only means selling pressure may be stretched.
The MACD at 0.011, below the signal line at 0.022 with a histogram of -0.011, keeps the short-term tone negative. MACD is a trend-following momentum tool, and the negative histogram shows the stock is still losing upward momentum rather than rebuilding it. In other words, the oscillators are not aligned: stochastic hints at exhaustion on the downside, while MACD says the rebound has not yet been confirmed.
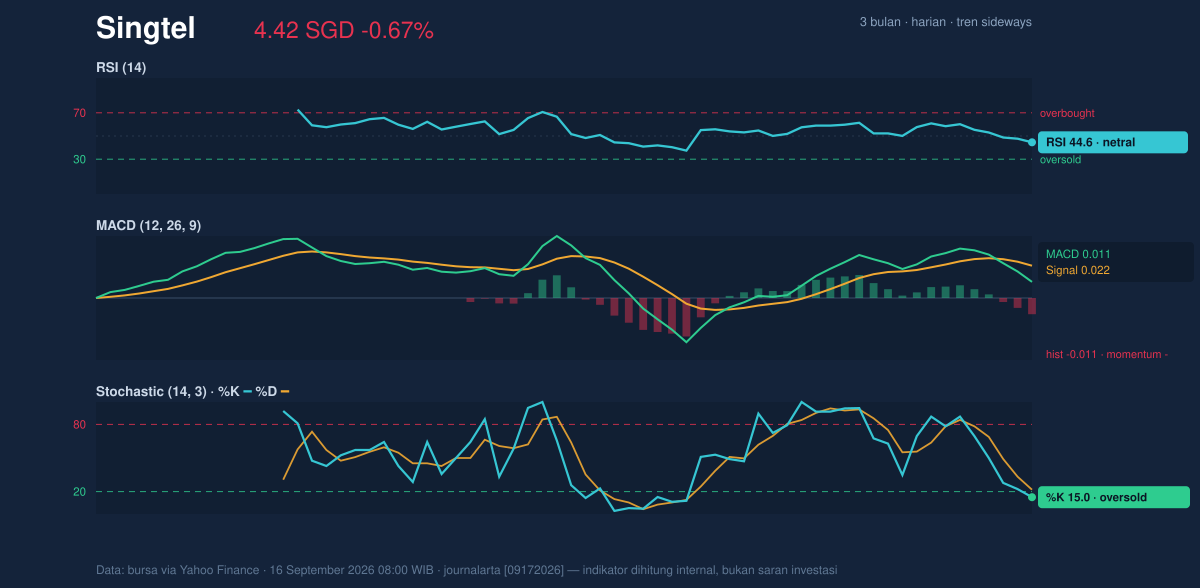
That divergence is why the chart reads as a wait-and-see setup rather than a clean reversal. The market may be compressed, but compression alone does not tell you which side will win.
Volatility & Volume
Volatility is currently contained. The Bollinger Bands are relatively tight, with the upper band at 4.58, the middle band at 4.49, and the lower band at 4.39. The %B at 15% shows price is sitting very close to the lower band, which often reflects weak near-term demand or a market testing support. The key detail is the 4.2% band width, which is narrowing. That is the classic squeeze condition: volatility has contracted, and the next move can be sharper once price escapes the band.
The ATR(14) at 0.07, or 1.7% of price, confirms that day-to-day swings are moderate rather than wild. That matters because a squeeze with moderate ATR often precedes a directional break, but not always immediately. Traders watching the chart are likely waiting for price to leave the lower band area and test whether buyers can reclaim the middle band at 4.49.
Volume does not yet confirm that kind of turn. Last volume was 14,805,500, below the 20-hour average of 19,104,083, or about 0.8x normal. That means the latest move lower happened without strong participation, which weakens the case for aggressive selling but also weakens any rebound signal. The OBV is falling, and that is the more important clue: on-balance volume tracks whether money is accumulating or leaving the stock, and a falling OBV suggests distribution is still outweighing accumulation.
Key Levels & Scenarios
The immediate map is fairly clear. 4.40 is the first support to watch, and 4.39 is the lower Bollinger band. If price holds that zone, the stock has room to attempt a move back toward 4.49 and then 4.56. If it loses 4.40, the chart opens the door to a retest of the 3-month low at 4.19, which would signal the squeeze is resolving to the downside.
Resistance is layered rather than absolute. 4.49 is the middle Bollinger line and the SMA20, so it is the first hurdle where short-term sellers may reappear. Above that, 4.56 is the near-term ceiling, and only a move through that zone would start to repair the chart structure. The current setup therefore depends less on prediction and more on confirmation: the market is compressed, but it still has to show its hand.
Technical Verdict: HOLD (wait & see)
HOLD (wait & see)
- RSI at 44.6 is neutral, so there is no strong momentum edge.
- Stochastic is oversold, but MACD remains negative, so downside pressure has eased without a confirmed reversal.
- Bollinger Bands are squeezing and volume is only 0.8x normal, which points to a pending move but not yet a confirmed one.
Verdict invalidated if price breaks 4.40 and fails to recover, because that would expose the 4.39 lower band and then the 4.19 three-month low.
- Ideal Entry Range: 4.40 to 4.49
- Exit Target: 4.56
- Stop Loss protection: below 4.39
For non-traders, this means the stock is close to support, but the chart has not yet shown enough strength to call a decisive turn.
Summary Data Singtel
| Last price | 4.42 SGD |
| Change 1 day / 5 days / 1 month | -0.67% / -3.07% / -0.23% |
| Trend / MA-cross | sideways / none |
| SMA20 / SMA50 | 4.49 / 4.44 |
| RSI (14) / Stochastic %K | 44.6 / 15.0 |
| Bollinger %B / ATR | 15% / 0.07 |
| Support / Resistance 20 days | 4.40 / 4.56 |
| Data as of | 16 September 2026 08:00 WIB |


