DBS Stock Analysis: Gains 0.07%, Momentum Weakens
On September 17, 2026: price 76.80 SGD, trend sideways, RSI 53.0, support 75.56, resistance 78.65. technical analysis of dbs stock. DBS Stock Analysis — full…

DBS Group’s shares were last at SGD 76.80 on SGX, up 0.07% from the previous close of 76.75, but the bigger message in the tape is that the stock is still moving sideways rather than starting a clean new leg. As shown in the chart, DBS is trading below its SMA20 at 76.97 but well above its SMA50 at 75.08, which usually means the medium-term structure is intact even as short-term momentum cools. The share price is sitting around 40% of the 20-hour range, not near a breakout point yet, and the recent move has been modest: -0.90% over 5 days and 1.05% over 1 month.
Trend & Price Action
The technical picture is best described as a market that has not chosen a direction. The trend is explicitly marked sideways, and the SMA20 slope of 0.28% over 5 days suggests only a gentle upward tilt, not a strong trend. That matters because when price is below the short-term average but above the longer average, traders are often watching for whether the stock is merely pausing or losing pace. Here, the lack of a fresh MA-cross means there is no new signal from the moving averages to confirm a trend change.
The broader range also frames the story. DBS is trading below the 20-hour resistance of 78.65 and above the 20-hour support of 75.56, with the 3-month high at 79.05 and low at 63.08. That places the stock closer to the upper end of its recent band, but not yet at the point where buyers have forced a decisive test of the top. The chart’s narrowing Bollinger Bands reinforce that reading: the market is compressing, which often precedes a larger move, but not necessarily in either direction.
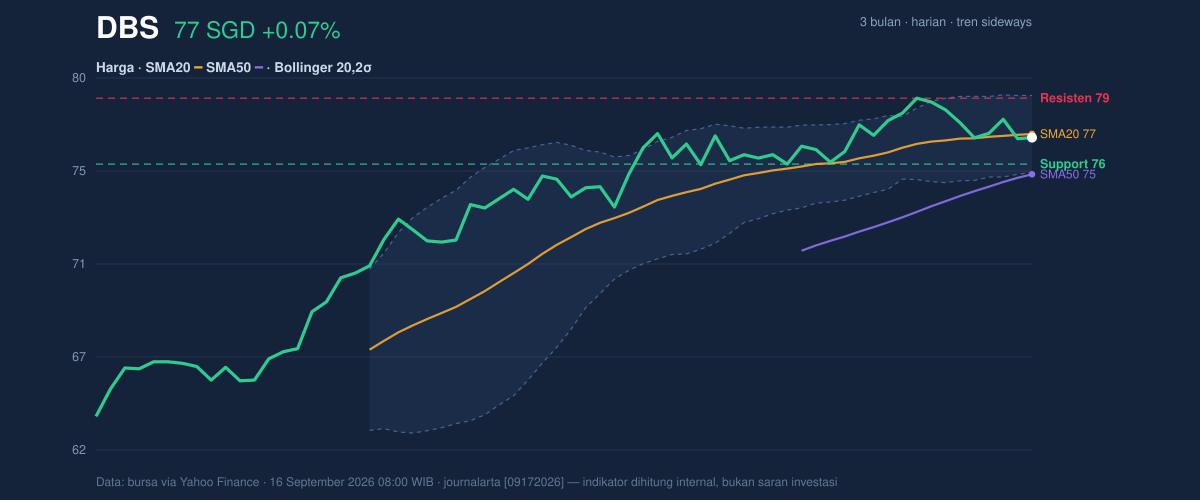
One sentence captures it: DBS is coiling, not trending.
Oscillators & Momentum
The momentum tools are not giving a strong directional lead. The RSI at 53.0 is neutral, which means the stock is neither stretched to the upside nor washed out to the downside. The Stochastic %K at 38.4 and %D at 45.8 also sit in neutral territory, but the positioning below the %D line points to a softer near-term tone. That is not a bearish collapse signal; it is more of a warning that upside urgency has faded.
The clearest weakness comes from MACD. With MACD at 0.684 versus its signal at 0.943 and a histogram of -0.259, the short-term momentum line is below its trigger line, which typically means the current push is losing strength. In plain English: price can still hold steady while momentum slips underneath, and that is often how ranges start before a fuller move develops.
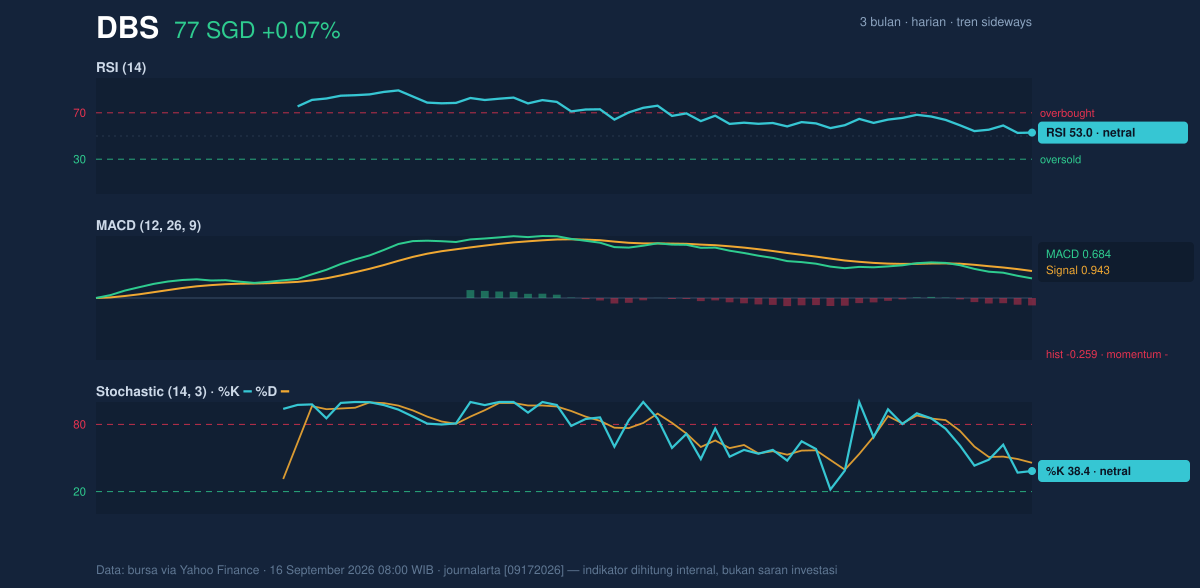
So the signal is mixed, but not random: RSI neutral, Stochastic neutral, MACD negative.
Volatility & Volume
Volatility is subdued. The ATR of 0.92, equal to 1.2% of price, says the stock is not swinging widely from day to day. Low ATR often goes hand in hand with a squeeze in Bollinger Bands, and here the band width is only 4.7%, explicitly described as narrowing. That combination matters because compression can act like a spring: it does not tell you direction, but it does tell you the market may be storing energy for a sharper move once a boundary gives way.
Volume is not yet confirming a breakout attempt. Last volume was 2,832,200, below the 20-hour average of 3,455,455, or about 0.8× normal. At the same time, OBV is falling, which means volume flow is not supporting the price as strongly as the chart might suggest. That is important because a stock can drift upward on light trading, but without participation the move often lacks follow-through. Put simply: the market is quiet, and quiet does not equal conviction.
Key Levels & Scenarios
The nearest levels are well defined. Support at 75.56 is the first line that matters; if price stays above it, the sideways structure remains intact. Below that, the SMA50 at 75.08 becomes the next obvious technical reference, because a break under the longer average would weaken the current setup and suggest the recent stability is fading. On the upside, resistance at 78.65 is the first hurdle, with the Bollinger upper band at 78.77 and the 3-month high at 79.05 sitting just above it. That cluster is the real test zone: if DBS can move through it with stronger volume, the squeeze would start to resolve in favor of expansion rather than drift.
If the stock fails to hold 75.56, the market would be telling traders that the range is breaking down rather than merely pausing. If it clears 78.65 and then 78.77, the chart would shift from compression to expansion, which is usually where momentum traders pay attention.
Technical Verdict: HOLD (wait & see)
HOLD (wait & see)
- MACD is negative with the histogram below zero, showing momentum is weaker than the price alone suggests.
- Price is below SMA20 while the broader structure remains above SMA50, a classic mixed signal rather than a clean trend.
- Bollinger Bands are squeezing, which often precedes a move but does not confirm direction yet.
Verdict invalidated if price falls below 75.56, because that would break the nearest support and weaken the range structure.
- Ideal Entry Range: 75.56 to 76.97
- Exit Target (Target Price): 78.65 to 78.77
- Stop Loss protection: below 75.08
For non-traders, this means DBS is sitting in a tight technical pause, and the next move matters more than the current one.
“The market is waiting for DBS to show its hand.”
Summary Data DBS
| Last price | 76.80 SGD |
| Change 1 day / 5 days / 1 month | 0.07% / -0.90% / 1.05% |
| Trend / MA-cross | sideways / none |
| SMA20 / SMA50 | 76.97 / 75.08 |
| RSI (14) / Stochastic %K | 53.0 / 38.4 |
| Bollinger %B / ATR | 45% / 0.92 |
| Support / Resistance 20 days | 75.56 / 78.65 |
| Data as of | 16 September 2026 08:00 WIB |


