OCBC Stock Analysis: Gains 0.58%, Testing Support Level
On September 17, 2026: price 31.18 SGD, trend sideways, RSI 52.2, support 30.78, resistance 32.27. technical analysis of ocbc stock. OCBC Stock Analysis — full…

OCBC Bank’s shares on SGX were last quoted at 31.18 SGD, up 0.58% from the previous close, but the move sits inside a broader pattern that still looks more like consolidation than a fresh trend. The stock is trading below its 20-day moving average at 31.42, even as it remains above the 50-day average at 30.14, which tells the market is not in a clean downtrend, but it has yet to reclaim short-term control. As shown in the chart, that positioning matters because it often marks a pause zone where buyers and sellers are still testing each other rather than committing to a decisive direction.
Trend & Price Action
The chart shows OCBC in a sideways trend, with the 20-day slope rising only 0.05% over 5 days. That is a very shallow incline, so it suggests stability more than momentum. The share price is sitting near the lower half of its recent range, at 27% of the 20-day support-resistance band, which means it is closer to support than to resistance. That is not a bearish breakdown signal by itself, but it does imply the market has been unable to sustain trade above the mid-band area around the 20-day average.
The broader range also matters. OCBC’s 3-month high is 32.57, while the 3-month low is 23.74. With the current price at 31.18, the stock is still trading relatively near the top of that wider range, even though it is below the short-term mean. In plain terms, long-term positioning remains constructive, but near-term price action is still capped.
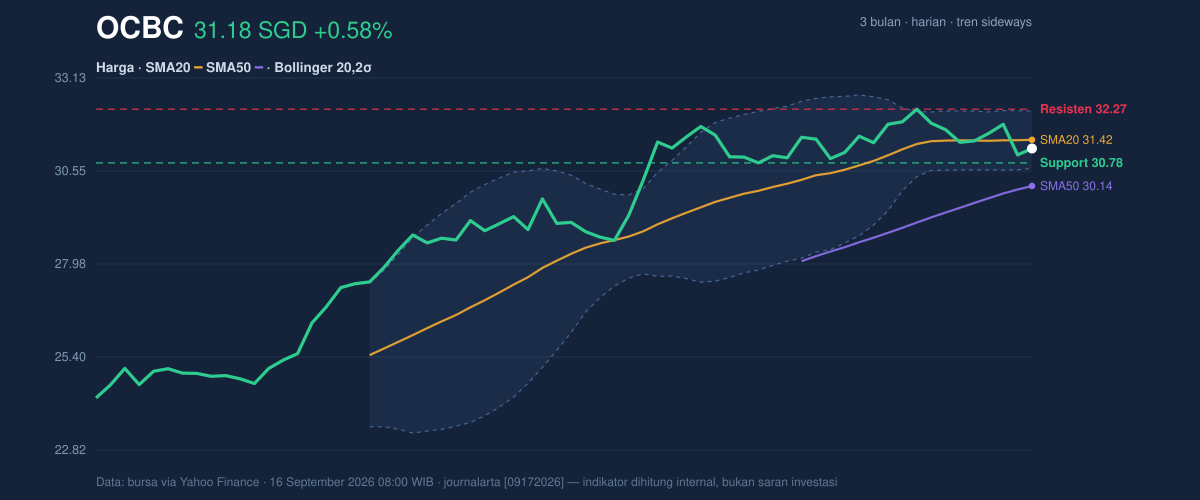
The most important short-term markers are the support at 30.78 and the resistance at 32.27. A move through resistance would signal that buyers are finally absorbing supply around the recent ceiling. A failure to hold support would do the opposite and suggest the stock is slipping back toward the lower edge of its trading band.
Oscillators & Momentum
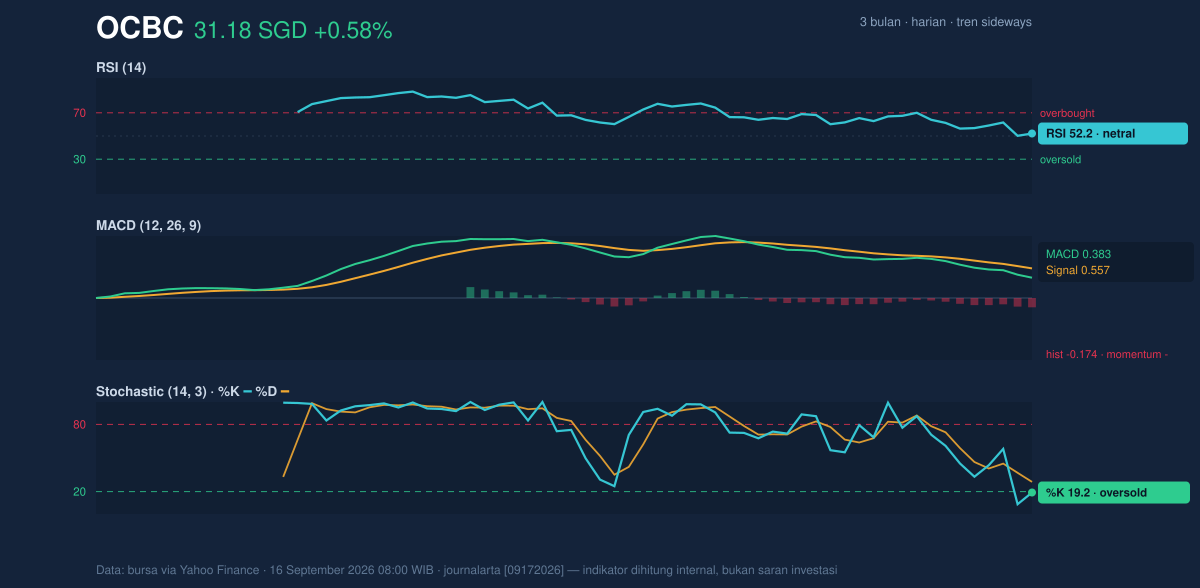
Momentum is mixed, and that mix is the main reason the chart does not yet point to a clean directional break. The RSI at 52.2 is neutral, which means the stock is neither stretched upward nor under obvious selling pressure. But the Stochastic %K at 19.2 and %D at 28.7 are in oversold territory, showing the share price has recently weakened enough to leave it vulnerable to a rebound if buyers step in. That is an early recovery signal, not a confirmation.
The MACD remains negative, with the line at 0.383 below the signal line at 0.557 and a histogram of -0.174. In practical terms, that says downside momentum has not fully cleared, even if the stock is not in a broad selloff. When MACD is negative while stochastic is oversold, the message is usually that the market is stretched short term, but the trend has not yet turned. Traders often watch for the MACD gap to narrow before treating a rebound as more than a bounce.
Volatility & Volume
Volatility is moderate, with ATR(14) at 0.52, or 1.7% of price. That means the stock is moving enough to create tradable swings, but not enough to suggest disorderly price action. More importantly, the Bollinger Band width is only 5.1%, and the bands are narrowing. A squeeze like this often precedes a larger move, because compressed volatility tends to release into expansion once the market chooses a direction.
The current location inside the bands is also telling. With %B at 35%, OCBC is sitting in the lower portion of the Bollinger structure, below the midpoint but not at the lower band. That positioning is consistent with a stock that is soft but not broken. Volume adds a useful layer of confirmation: the latest turnover was 5,708,300, slightly above the 20-day average of 5,399,085, or 1.1x normal. That suggests participation is present, not absent. The fact that OBV is rising is especially important, because it indicates cumulative buying pressure has been improving even while price remains range-bound. In other words, the tape is not showing panic selling.
Key Levels & Scenarios
The immediate technical map is straightforward. 30.78 is the nearest support, and 32.27 is the nearest resistance. Between those two levels, the stock is still trapped in a consolidation zone. If price can reclaim the 31.42 SMA20 and push through 32.27, the chart would start to look like a breakout from the current squeeze. If instead the share price slips below 30.78, the short-term structure weakens and the market would likely test whether the 30.14 SMA50 can act as a deeper floor.
The squeeze in Bollinger Bands makes these levels more meaningful than usual, because compressed bands often amplify the next move once support or resistance gives way. That is why the current setup is less about today’s small gain and more about whether the stock can escape the narrow range with conviction.
Technical Verdict: HOLD (wait & see)
The chart leans to HOLD (wait & see) because the signals are not aligned yet: price is below the SMA20, MACD is negative, and the trend is still sideways, even though stochastic is oversold and OBV is rising. The Bollinger squeeze also argues for patience, since it points to a coming move but not the direction. The verdict is invalidated if price breaks below 30.78, because that would weaken the current support structure and increase the odds of a deeper retracement.
- Ideal Entry Range: 30.78 to 31.42, using support and the SMA20 area as the technical zone to monitor
- Exit Target: 32.27, with the upper Bollinger band at 32.22 as the nearby reference
- Stop Loss protection: below 30.78, with 30.14 as the deeper structural reference if support fails
In plain English, the stock is not flashing a clear trend signal yet, but it is compressing enough that the next move could matter more than the last few sessions.
The next technical checkpoint is whether OCBC can close back above 31.42 and challenge 32.27.
Summary Data OCBC
| Last price | 31.18 SGD |
| Change 1 day / 5 days / 1 month | 0.58% / -0.54% / 0.78% |
| Trend / MA-cross | sideways / none |
| SMA20 / SMA50 | 31.42 / 30.14 |
| RSI (14) / Stochastic %K | 52.2 / 19.2 |
| Bollinger %B / ATR | 35% / 0.52 |
| Support / Resistance 20 days | 30.78 / 32.27 |
| Data as of | 16 September 2026 08:00 WIB |


