AMD Stock Gains 6.36% Today, Testing Key Resistance
On September 18, 2026: price 545.09 USD, trend sideways, RSI 62.6, support 456.16, resistance 545.09. technical analysis of amd stock. AMD Stock Gains — full…

For AMD, the immediate story is not just that the shares rose; it is that they pushed into the top of a year-to-date-style trading band with momentum still strong, but short-term conditions now looking stretched.
Advanced Micro Devices rose to 545.09 USD on Nasdaq, up 6.36% from the previous close of 512.50, extending a 8.24% gain over five days and a 16.87% advance over one month. That move matters because it came with volume, not just price. The stock traded 1.6× above its 20-session average, while OBV — a cumulative measure of whether volume is flowing in or out — is rising. In plain language, that means the latest push higher has been backed by participation rather than a thin, easily reversed move.
Trend & Price Action
AMD is still described as sideways, but that label needs context. The 20-day simple moving average is 486.24, while the 50-day is 495.59, and the share price is sitting well above both. That tells investors the stock has moved from neutral territory into a firmer short-term position, even if the broader trend has not yet produced a fresh moving-average crossover. The absence of a new MA-cross means the market has not fully confirmed a longer, cleaner trend change; instead, the recent strength has arrived through price acceleration inside a range.
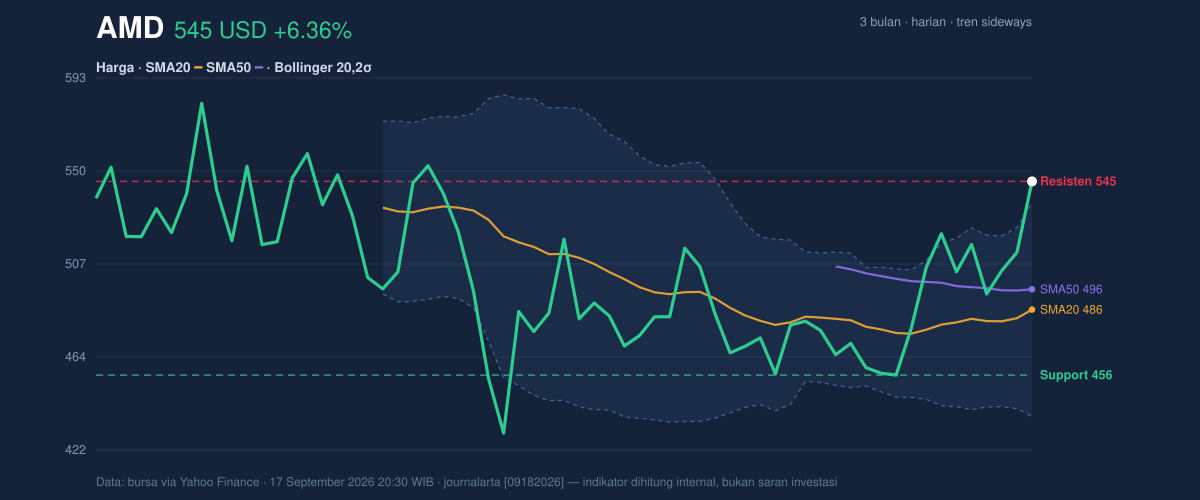
The chart also shows AMD at the very top of its 20-session range, with 545.09 now acting as the session’s resistance level as well as the latest price. That is important because a stock that closes at the top of its band often signals urgency from buyers, but it can also signal exhaustion if follow-through fails. The 3-month high is 584.73 and the 3-month low is 424.03, so AMD is trading much closer to the upper end of that corridor than the lower end. In market terms, the stock is not cheap on a short-term technical basis; it is pressing against the ceiling.
Oscillators & Momentum
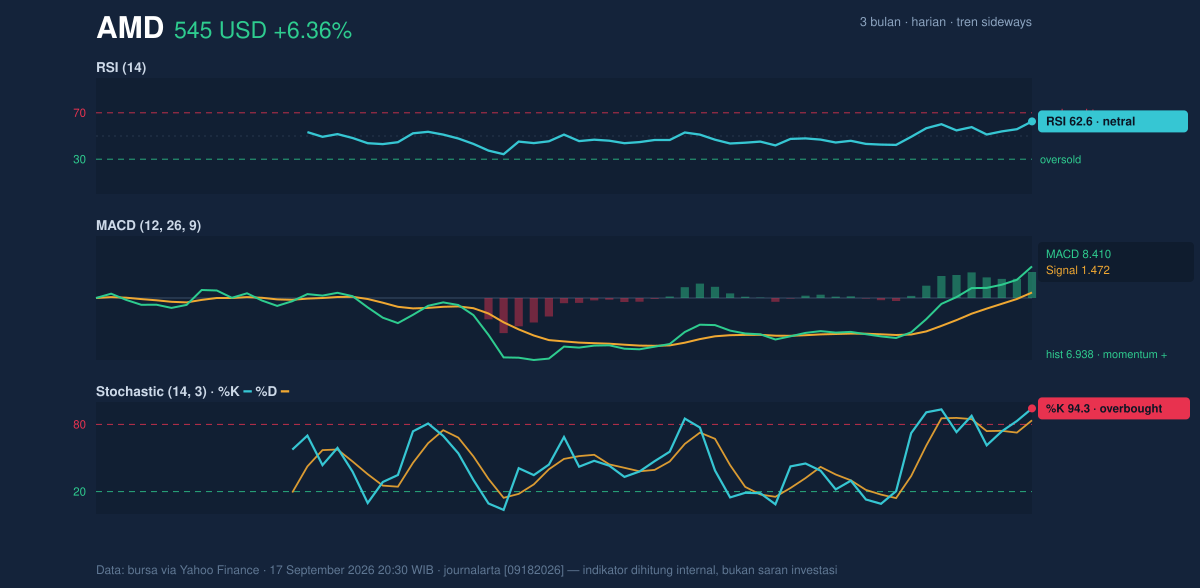
Momentum indicators are telling a more nuanced story than the headline price gain. The RSI at 62.6 is still neutral, which means the stock is not yet in the classic overbought danger zone on that measure. But the Stochastic %K at 94.3 and %D at 83.7 are overbought, which usually means the recent rally has moved fast enough that short-term traders may already be crowded into the same direction. In simple terms, RSI says the stock is strong; Stochastic says it may be getting stretched.
The MACD is 8.410, above its 1.472 signal line, with a 6.938 histogram. That is a clear positive momentum read, and it means the recent price trend is still outrunning its own average. When MACD is positive and the histogram is expanding, it often suggests buyers remain in control for now. The catch is that momentum can stay elevated while the stock becomes more vulnerable to a pause or pullback, especially when oscillators are already overbought.
Volatility & Volume
Volatility is elevated, and the chart makes that visible. Bollinger Bands are widening, with the upper band at 535.26, the middle band at 486.24, and the lower band at 437.22. The %B at 110% shows AMD trading above the upper band, which usually signals a strong breakout attempt or an overextended condition. It is a sign of force, but also a sign that the stock has moved beyond its recent statistical envelope.
That matters even more because ATR(14) is 21.98, or 4.0% of price, which means the stock can swing sharply in either direction on a normal day. The Bollinger width of 20.2% confirms that the market is not calm; it is active and capable of large moves. For readers outside trading circles, ATR is a rough gauge of typical daily movement. A higher reading means wider price swings and less room for complacency.
Volume confirms the move, but not necessarily its durability. The jump to 28,380,800 shares versus a 20-session average of 18,222,240 suggests real demand. Yet when volume comes alongside an overbought stochastic and a price above the upper Bollinger band, it often means the market is testing how much more enthusiasm remains after a fast run.
Key Levels & Scenarios
The most important support level in the data is 456.16, while the nearest resistance is the current price area at 545.09. Because AMD is already at resistance and above the upper Bollinger band, the immediate question is whether buyers can turn this level into a base. If they do, the move would imply the market is willing to accept a higher trading range. If not, the stock may revert toward the 20-day average near 486.24, where the market has recently found balance.
The stronger medium-term reference is the 3-month high at 584.73. That level is not just a number; it is the next visible test of whether this rally is becoming something more durable than a short squeeze or momentum burst. On the downside, a loss of 456.16 would weaken the current technical structure and point back toward the lower part of the recent range.
Technical Verdict: HOLD (wait & see)
HOLD (wait & see)
- MACD is positive, showing trend momentum remains supportive.
- Volume is 1.6× average and OBV is rising, which confirms participation behind the move.
- Stochastic is overbought and %B is 110%, so the stock is extended above its recent volatility band.
Verdict invalidated if price falls below 456.16.
- Ideal Entry Range: 486.24 to 495.59, near the SMA20/SMA50 zone if price cools back into support.
- Exit Target: 584.73, the 3-month high and the next visible resistance reference.
- Stop Loss protection: 456.16, the 20-session support floor.
For non-traders, this means AMD is strong, but the chart is asking for proof that the rally can keep going without first taking a breather.
“The stock has momentum, but after a 6.36% jump in one day and a push beyond the upper Bollinger band, the market is now asking whether buyers still have fuel.”
Summary Data AMD
| Last price | 545.09 USD |
| Change 1 day / 5 days / 1 month | 6.36% / 8.24% / 16.87% |
| Trend / MA-cross | sideways / none |
| SMA20 / SMA50 | 486.24 / 495.59 |
| RSI (14) / Stochastic %K | 62.6 / 94.3 |
| Bollinger %B / ATR | 110% / 21.98 |
| Support / Resistance 20 days | 456.16 / 545.09 |
| Data as of | 17 September 2026 20:30 WIB |



