LLY Stock Technicals Today: Gains 1.28%, Death Cross Pressure
On September 18, 2026: price 1,152.44 USD, trend downtrend, RSI 47.5, support 1,115.70, resistance 1,255.40. technical analysis of lly stock.

Eli Lilly shares rose to $1,152.44 on the NYSE, up 1.28% from the previous close of $1,137.82, but the move sits inside a broader pullback: the stock is still down 9.99% over one month and remains in a downtrend as shown by the chart and the slope of the SMA20. That matters because a one-day bounce can mean traders are testing whether the decline is tiring, while a price still below its short-term averages usually says the market has not yet accepted a clean reversal.
Trend & Price Action
The key signal is that LLY is trading below the SMA20 at $1,167.89 and also below the SMA50 at $1,178.64. That puts the stock on the weak side of both short- and medium-term trend gauges. The death cross — where the SMA20 moved below the SMA50 — reinforces that message: it is a classic sign that recent momentum has been weaker than the longer trend, often prompting systematic traders to treat rallies with caution.
The chart also shows the price sitting at roughly 26% of the 20-day range, closer to the lower end than the upper end. That positioning matters because it suggests the rebound has not yet reclaimed the area where sellers recently gained control. The 20-day support at $1,115.70 is the first level that matters on the downside, while $1,255.40 is the nearby resistance band where prior advances have stalled. The broader 3-month low of $1,079.22 and 3-month high of $1,292.65 frame the current move inside a wide but still unresolved range.
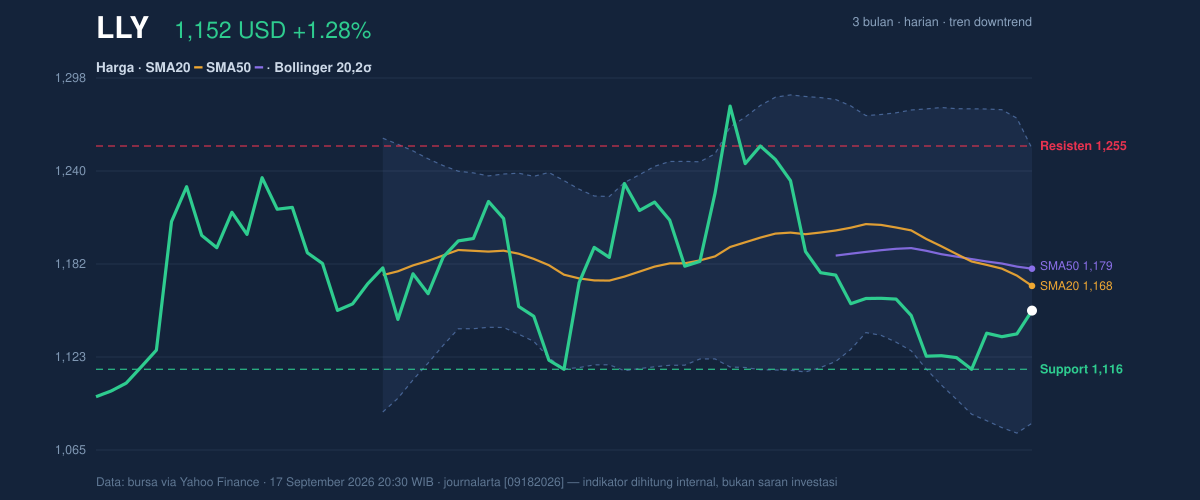
The Bollinger Bands, which map where price is trading relative to its recent average, add a useful nuance. LLY is below the middle band at $1,167.89, but not near the lower band at $1,081.94. With %B at 41% and band width at 14.7%, the setup points to a market that is neither stretched nor compressed. In plain English: the stock is weak, but not yet in a panic zone, and the tape still has room to move either way.
Oscillators & Momentum
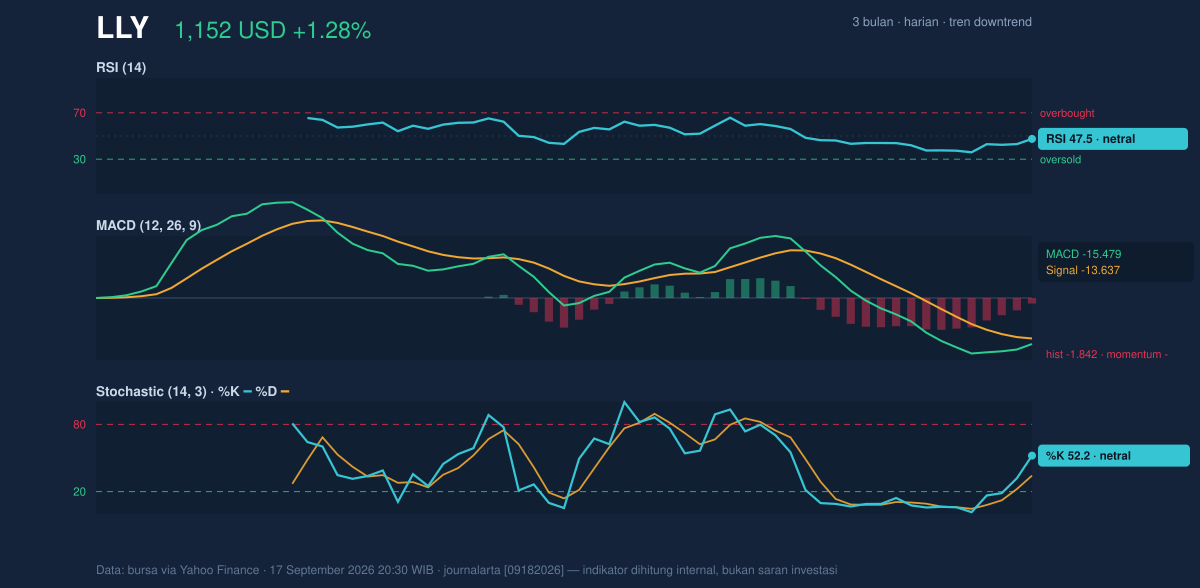
Momentum indicators are mixed, which is exactly what a market in repair often looks like. RSI at 47.5 is neutral, meaning the stock is neither oversold nor overbought. That is important because it tells readers the recent decline has not reached the kind of extreme that often forces bargain hunters to step in aggressively. The Stochastic %K at 52.2 and %D at 34.2 is also neutral, but with %K above %D, there is a mild short-term improvement in momentum. The catch is that this improvement has not yet translated into a trend shift.
The MACD at -15.479, still below its signal line at -13.637, with a histogram of -1.842, is the clearest warning sign in the set. MACD turning negative means the stock’s medium-term momentum remains under pressure. The histogram being below zero shows the gap between the MACD line and its signal line is still unfavorable, so the rebound has not yet earned confirmation. In practical terms, traders may be buying dips, but the broader trend has not been persuaded.
Volatility & Volume
Volatility is present, but not extreme. The ATR(14) of 25.48, equal to 2.2% of price, suggests average daily swings are still meaningful enough to matter, yet not so wide that price action looks disorderly. That gives the stock room to test support or resistance without needing a major news shock.
Volume is less encouraging. The latest trade came on 1,896,400 shares, below the 20-day average of 2,278,080, or about 0.8x normal. That means the bounce arrived without full participation from the market. When a rally happens on lighter volume, it often signals hesitation rather than conviction. The OBV is falling, which deepens that concern: on-balance volume tracks whether money is flowing in or out, and a declining line implies sellers have still been more persistent than buyers across recent sessions.
Key Levels & Scenarios
The immediate battle is between $1,115.70 support and $1,255.40 resistance. If the stock loses $1,115.70, the chart opens the door toward the broader 3-month low at $1,079.22, and that would suggest the current rebound was only a pause. If instead LLY can reclaim the SMA20 at $1,167.89 and then push through $1,178.64, the tone improves because price would be back above the trend markers that currently cap it. A move toward $1,253.83, the upper Bollinger Band, would then become the next technical test.
The key point is not just where the numbers sit, but what they say together: trend is weak, momentum is only stabilizing, and volume has not yet confirmed a durable turn. That combination usually favors patience over urgency.
Technical Verdict: HOLD (wait & see)
HOLD (wait & see)
- Reason 1: price is below both the SMA20 at $1,167.89 and SMA50 at $1,178.64, with a death cross still signaling a weaker trend structure.
- Reason 2: MACD remains negative at -15.479, and the histogram at -1.842 shows momentum has not yet flipped back into positive territory.
- Reason 3: volume is only 0.8x normal and OBV is falling, so the rebound lacks the participation usually needed to confirm a sustained recovery.
- Verdict invalidated if price breaks below $1,115.70, because that would put the stock at risk of revisiting the $1,079.22 area.
- Ideal Entry Range: $1,115.70 to $1,167.89
- Exit Target (Target Price): $1,178.64 to $1,255.40
- Stop Loss protection: below $1,115.70, with deeper risk if $1,079.22 fails
In plain English, LLY is trying to stop falling, but it has not yet proved that the recovery is real.
Summary Data LLY
| Last price | 1,152.44 USD |
| Change 1 day / 5 days / 1 month | 1.28% / 2.62% / -9.99% |
| Trend / MA-cross | downtrend / death |
| SMA20 / SMA50 | 1,167.89 / 1,178.64 |
| RSI (14) / Stochastic %K | 47.5 / 52.2 |
| Bollinger %B / ATR | 41% / 25.48 |
| Support / Resistance 20 days | 1,115.70 / 1,255.40 |
| Data as of | 17 September 2026 20:30 WIB |



