MRK Stock Gains 1.55%, Momentum Weakens In Focus
On September 18, 2026: price 147.15 USD, trend sideways, RSI 56.5, support 143.79, resistance 156.45. technical analysis of mrk stock. MRK Stock Gains — full…

Merck is trading in a market where the shares are still holding above longer-term support, but the latest signals say the stock has not yet reclaimed full short-term momentum. As of 17 September 2026, the NYSE-listed shares were at 147.15 USD, up 1.55% on the day after a 144.91 previous close, yet still below SMA20 at 148.85 even as they remain comfortably above SMA50 at 137.43. That split matters: it suggests the stock is not in a clear downtrend, but the near-term trend has not fully turned upward either.
Trend & Price Action
The chart shows a name that is still range-bound rather than trending cleanly, with the broader setup described as sideways and the SMA20 slope rising only 1.01% over 5 days. In plain language, that means the short-term average is moving up, but not fast enough to confirm a strong breakout phase. Price sitting below SMA20 usually signals that recent buying has not yet been strong enough to overpower the average trading level of the past month, while the fact that it remains above SMA50 keeps the medium-term structure intact.
The stock is also trading at roughly 27% of its 20-day range, with 20-hour support at 143.79 and 20-hour resistance at 156.45. That placement is important because it shows MRK is closer to the lower half of the range than the upper half, but not yet pressing into a breakdown zone. The broader 3-month high of 156.92 and 3-month low of 111.57 frame the current move as a recovery that has not fully converted into a decisive trend.
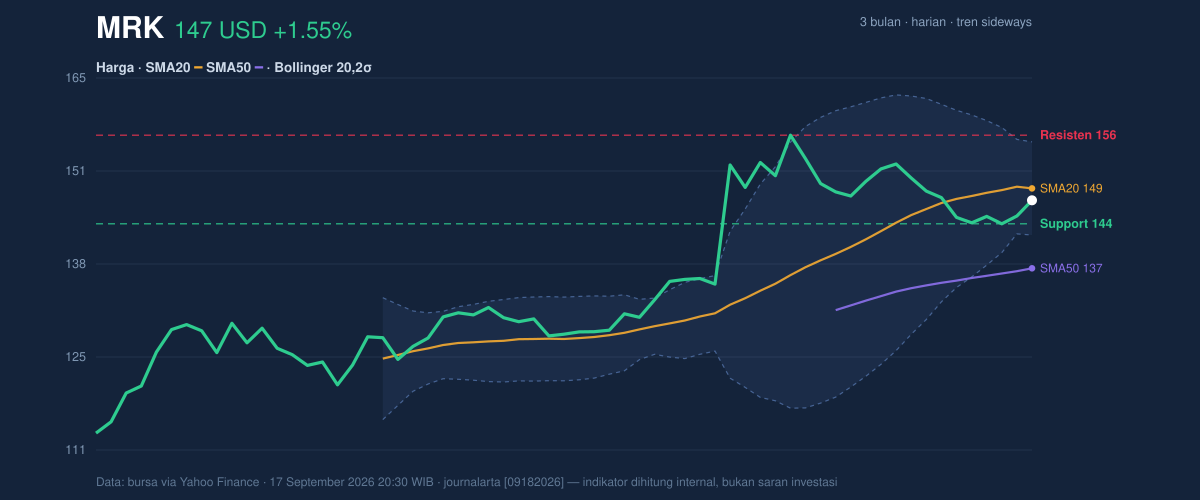
The key message from price action is simple: MRK is stabilizing, but it still needs confirmation above the short-term average to shift the narrative from consolidation to strength.
Oscillators & Momentum
The momentum picture is mixed, and that is where the story becomes more nuanced. The RSI(14) at 56.5 is neutral-to-constructive, meaning the stock is not overbought and still has room to extend if buyers return. But the Stochastic %K at 46.1 and %D at 27.4 also sit in neutral territory, which tells us the recent rebound has not yet become stretched. In other words, MRK is not flashing a classic exhaustion signal; it is simply not accelerating.
The more cautionary signal comes from MACD at 2.062 versus its signal line at 3.327, with a histogram of -1.266. For general readers, MACD compares short- and medium-term price momentum; when the histogram is negative, the stock’s recent pace is lagging behind the trend line. That matters because it suggests the rebound has lost some force even while price remains above the longer average.
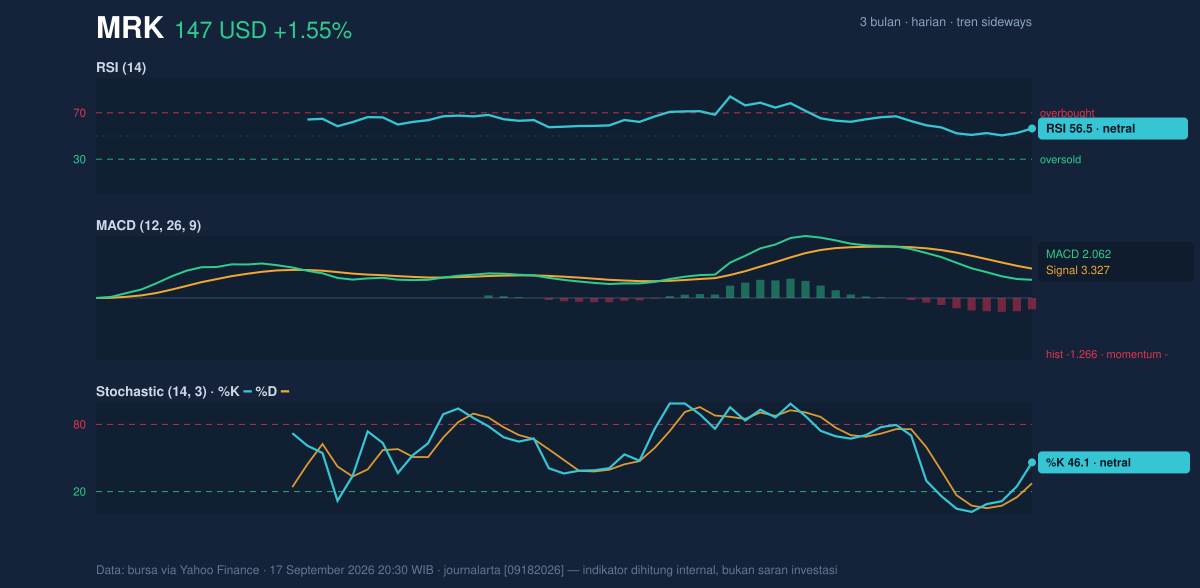
So the oscillators are not bearish in a dramatic sense, but they do say the stock has not yet earned a strong momentum confirmation.
Volatility & Volume
Volatility is moderate rather than explosive. The ATR(14) at 2.98, or about 2.0% of price, implies that daily moves are present but not wild. That typically favors a market that is digesting prior gains or losses instead of repricing aggressively. The Bollinger Bands reinforce that view: the upper band is 155.50, the middle band is 148.85, and the lower band is 142.19, with %B at 37% and band width at 8.9%.
%B tells us where price sits inside the band structure. At 37%, MRK is below the midpoint of the band range, which indicates it is not trading near the upper edge of enthusiasm. The band width being normal also means there is no squeeze suggesting an imminent volatility burst. Put simply, the chart is not coiling for a dramatic move yet.
Volume adds a small but important layer. The latest reading of 11,060,600 shares was about 1.1× normal versus the 20-day average of 9,861,660, which shows participation improved on the day. However, OBV is down, and that is the more telling signal: on-balance volume tracks whether volume is supporting price gains or declines over time. A falling OBV while price firms up can mean the rally is not fully backed by sustained accumulation.
The tape is active, but not fully convinced.
Key Levels & Scenarios
The immediate map is clear. 143.79 is the nearest support to watch, while 148.85 is the short-term pivot at SMA20 and the Bollinger middle band. Above that, 156.45 is the first resistance, with the 3-month high at 156.92 just above it. Those levels matter because they define whether MRK remains in a range or starts to challenge the top end of the recent structure.
If price holds 143.79 and pushes back above 148.85, the chart would improve because it would reclaim the short-term average and the Bollinger midpoint at the same time. If it fails to hold 143.79, the market would be signaling that the recent stabilization is losing traction, especially with MACD momentum still negative.
Technical Verdict: HOLD (wait & see)
HOLD (wait & see)
- SMA20 is above price, so the short-term trend has not yet been fully reclaimed.
- MACD histogram is negative, showing momentum is still weaker than the trend line.
- SMA50 remains below price, which prevents the setup from turning outright bearish.
Verdict invalidated if price falls below 143.79, because that would break the nearest support and weaken the range structure.
- Ideal Entry Range: 143.79 to 148.85
- Exit Target: 155.50 to 156.45
- Stop Loss protection: below 142.19
For non-traders: Merck looks steady, but it has not yet shown enough momentum to leave its current range behind.
The next chart test is whether the shares can reclaim 148.85 and then challenge 156.45 after the latest volume-supported move.
Summary Data MRK
| Last price | 147.15 USD |
| Change 1 day / 5 days / 1 month | 1.55% / 1.69% / -3.32% |
| Trend / MA-cross | sideways / none |
| SMA20 / SMA50 | 148.85 / 137.43 |
| RSI (14) / Stochastic %K | 56.5 / 46.1 |
| Bollinger %B / ATR | 37% / 2.98 |
| Support / Resistance 20 days | 143.79 / 156.45 |
| Data as of | 17 September 2026 20:30 WIB |


