NVDA Stock Gains 2.54%, Momentum Weakens In Focus
On September 18, 2026: price 219.34 USD, trend sideways, RSI 51.5, support 208.48, resistance 230.36. technical analysis of nvda stock.

Nvidia traded in New York at 219.34 USD on NASDAQ, up 2.54% from the previous close, but the move still leaves the stock inside a broad sideways band rather than in a clean breakout. The short version: price is holding above the near-term average, momentum is mixed, and the chart is waiting for confirmation.
Trend & Price Action
The stock is now sitting above the SMA20 at 218.61 and comfortably above the SMA50 at 213.88, which matters because it shows the longer short-term trend has not broken down even though the broader pattern is still described as sideways. That sideways label is important: it means buyers and sellers have been trading control back and forth, and the market has not yet committed to a directional move.
As shown in the chart, Nvidia is trading near the middle of its recent range, with support at 208.48 and resistance at 230.36. Price at 219.34 is close to the Bollinger middle band at 218.61, which usually signals balance rather than urgency. The stock is also well below the 3-month high of 234.76 and above the 3-month low of 189.80, reinforcing the idea that the market is consolidating rather than trending strongly.
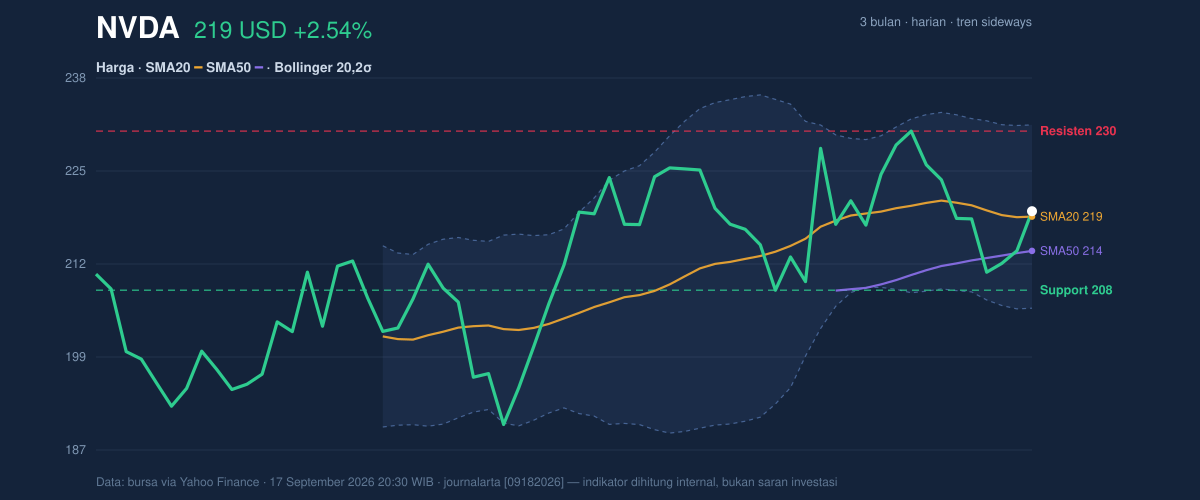
The Bollinger Band width of 11.5% is described as normal, not compressed. That means the market is not in an unusually tight squeeze that often precedes a sharp expansion, but it is also not already in a wide, unstable swing. In practical terms, the chart suggests room for movement, but not a clear technical trigger yet.
Oscillators & Momentum
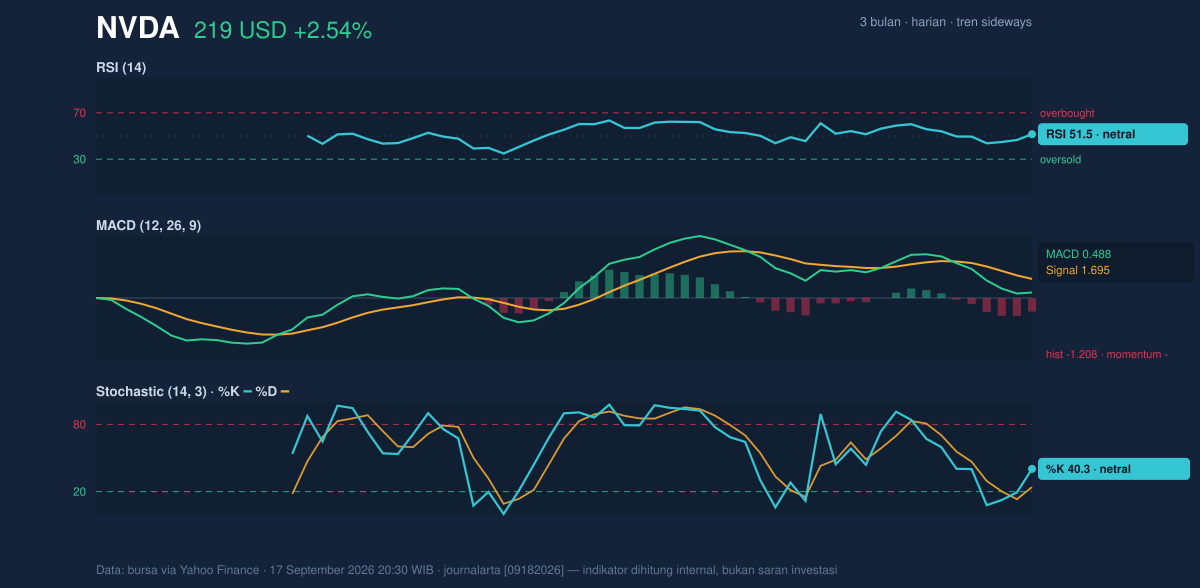
Momentum is the part of the picture that looks least convincing. The RSI at 51.5 is neutral, which means the stock is neither overbought nor oversold. That is usually a sign of indecision rather than strength or weakness. The Stochastic %K at 40.3 and %D at 24.0 also sit in neutral territory, but the gap between them suggests short-term momentum has improved from weaker levels without yet proving a sustained upside turn.
The more cautionary signal is the MACD histogram at -1.208, with MACD at 0.488 below the signal line at 1.695. For readers unfamiliar with the term, MACD is a trend-following momentum measure; when it sits below its signal line, it usually means the recent price trend is still losing force even if the share price has risen on the day. In other words, the rally is not yet fully confirmed by momentum.
That mixed setup explains why the stock can rise in the short term while still lacking a strong technical breakout. The market is not oversold, so there is no obvious rebound signal from exhaustion, but it is also not showing the kind of momentum alignment that typically accompanies a sustained advance.
Volatility & Volume
The ATR at 6.49, or about 3.0% of price, points to moderate volatility. ATR, or average true range, measures how much the stock typically moves in a day. A reading like this suggests Nvidia can still travel meaningfully in either direction, but not in a disorderly way. That makes nearby support and resistance levels more relevant than usual.
Volume, however, is softer than ideal for a decisive move. Last session volume was 93,960,500, below the 20-day average of 129,797,330, or about 0.7× normal. Lower volume on a price rise often means the move has not yet attracted broad participation. It can still continue, but the market usually wants heavier trading to validate a breakout.
The one constructive counterpoint is that OBV is rising. On-balance volume tracks whether volume is accumulating on up days or down days. A rising OBV tells us some buyers are still willing to step in even though the latest session did not come with full-volume conviction. That is a positive background signal, but not enough on its own to override the weak MACD setup.
Key Levels & Scenarios
The chart’s immediate map is straightforward. 208.48 is the first important support: if the stock slips back toward that area, the market would be testing whether the recent bounce has real staying power. Below that, the SMA50 at 213.88 is another reference point; losing it would weaken the short-term structure and suggest the stock is drifting back toward the lower half of the range.
On the upside, 230.36 is the near-term resistance that matters most. A move through that level would place Nvidia closer to the 3-month high at 234.76 and would start to turn the current sideways pattern into something more constructive. Until then, the stock remains range-bound, with the middle Bollinger band at 218.61 acting as a pivot rather than a launch point.
Technical Verdict: HOLD (wait & see)
HOLD (wait & see)
- RSI at 51.5 is neutral, so there is no strong overbought or oversold signal.
- MACD histogram at -1.208 shows momentum is still negative, even though price is above the SMA20 and SMA50.
- Volume at 0.7× normal suggests the latest move lacks strong participation, while OBV rising keeps the longer participation trend from turning outright weak.
Verdict invalidated if price breaks below 208.48.
- Ideal Entry Range: 218.61 to 208.48
- Exit Target: 230.36
- Stop Loss protection: below 208.48
Plain English: the stock is holding up, but the chart still needs stronger momentum and volume before the next move becomes clearer.
At 20:30 WIB on 17 September 2026, Nvidia’s 20-day average volume stood at 129,797,330.
Summary Data NVDA
| Last price | 219.34 USD |
| Change 1 day / 5 days / 1 month | 2.54% / 0.45% / 0.82% |
| Trend / MA-cross | sideways / none |
| SMA20 / SMA50 | 218.61 / 213.88 |
| RSI (14) / Stochastic %K | 51.5 / 40.3 |
| Bollinger %B / ATR | 53% / 6.49 |
| Support / Resistance 20 days | 208.48 / 230.36 |
| Data as of | 17 September 2026 20:30 WIB |



