ORCL Stock Gains 5.19% Today, Momentum Weakens
On September 18, 2026: price 150.59 USD, trend sideways, RSI 51.8, support 140.35, resistance 162.52. technical analysis of orcl stock.

Oracle is trading in a market that is still digesting a strong rebound, but the chart is not yet showing a clean breakout or breakdown. As of 17 September 2026 at 20:30 WIB, the NYSE-listed stock ORCL last changed hands at 150.59 USD, up 5.19% on the day after a 143.16 USD prior close. That move lifts the shares back above the short-term average, but the broader message from the indicators is more cautious: price is stabilizing inside a range, momentum is mixed, and volume is not confirming a decisive trend shift.
Trend & Price Action
The first signal is structural rather than dramatic. Oracle is still labeled sideways, and the SMA20 at 149.13 is only slightly below the current price, while the SMA50 at 140.93 sits further underneath. In plain language, the stock is trading above both its short- and medium-term averages, which usually means the longer trend is healthier than the day-to-day noise. But the detail that matters is the slope: the SMA20 is falling at -0.36% over 5 days, which tells investors that the latest bounce has not yet reversed the short-term drift.
That is why the chart matters here.
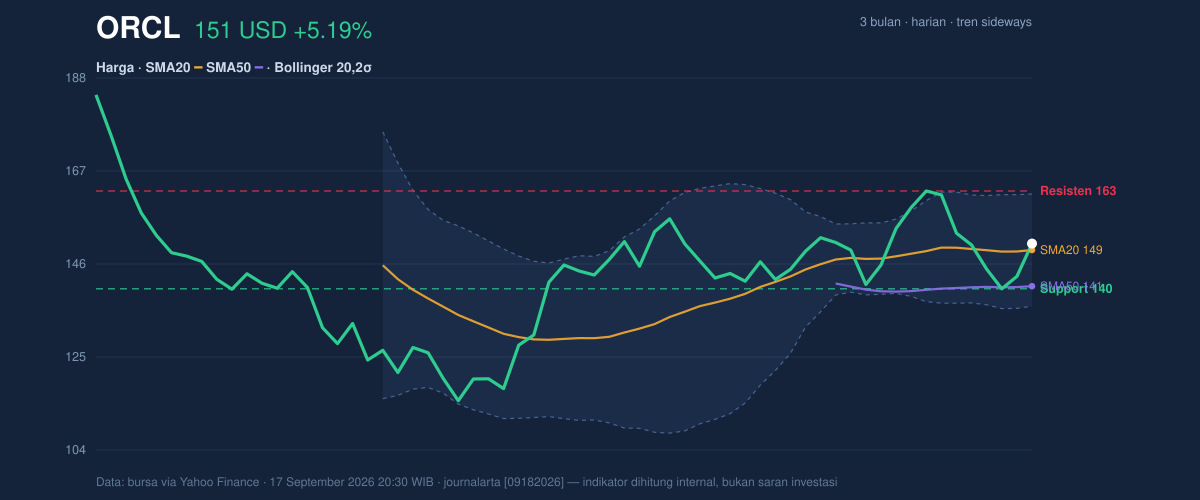
Price is sitting around 46% of the 20-hour range, with 20-hour support at 140.35 and 20-hour resistance at 162.52. That places Oracle in the middle of the corridor, not at an extreme. The stock is also well below its 3-month high of 187.99 and comfortably above its 3-month low of 114.50, reinforcing the idea that the name is range-bound rather than trending aggressively in either direction.
A mid-range stock needs confirmation, not applause.
Oscillators & Momentum
The momentum picture is more restrained than the price action. RSI(14) at 51.8 is neutral, which means the stock is neither stretched to the upside nor washed out. That is important because a neutral RSI often appears when a rebound is still early or when a move is losing urgency. The Stochastic %K at 36.6 and %D at 17.2 are also neutral, though the gap between them suggests the stock is trying to recover from a softer zone without yet proving a strong impulse.
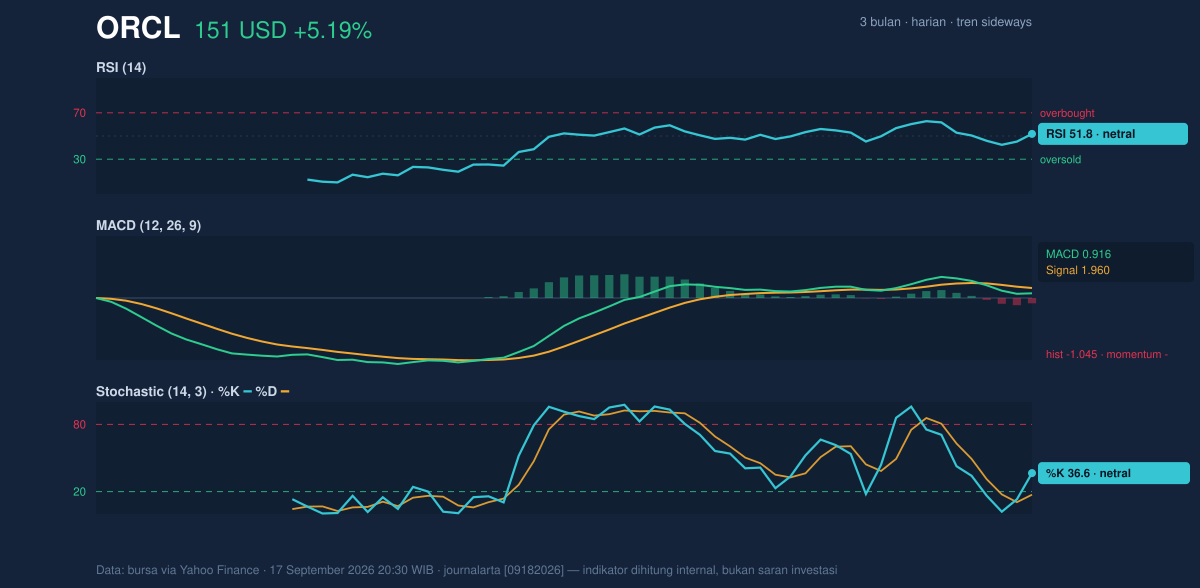
The clearest warning comes from MACD. Oracle’s MACD at 0.916 is below the signal line at 1.960, and the histogram at -1.045 is negative. For general readers, that means the shorter-term pace of the move is weaker than the smoother trend line, a common sign that upward momentum has faded even if price has not fully rolled over. So while the stock is above key averages, the momentum engine is not fully aligned with the price.
That mismatch is the key story.
Volatility & Volume
Volatility remains elevated enough to matter. Oracle’s ATR(14) is 8.08, or 5.4% of price, which signals that daily swings can be meaningful even when the overall trend looks flat. The Bollinger Bands help frame that tension: the upper band is 161.83, the middle band is 149.13, and the lower band is 136.44. With %B at 56% and a 17.0% band width, the stock is sitting just above the middle of the envelope, with volatility in a normal range rather than in a squeeze. In practical terms, the market is not coiling for a dramatic breakout right now, but it is still capable of a fairly wide move if a catalyst appears.
Volume does not yet validate the day’s rise. Last volume was 27,668,800, slightly below the 20-hour average of 29,100,255, or roughly 1.0× normal. That is close enough to average to avoid calling it a weak session, but not strong enough to say institutions are rushing in. More importantly, OBV is down, which means cumulative volume flow has been softer even as price has tried to recover. When price rises but OBV falls, the market is often saying the move lacks broad sponsorship.
Key Levels & Scenarios
The market is now watching a fairly clean set of levels. On the upside, 162.52 is the first meaningful resistance, and it sits just below the Bollinger upper band at 161.83, making that zone a natural test for any extension. On the downside, 140.35 is the nearest support and lines up close to the SMA50 at 140.93, which makes that area especially important. If Oracle can hold above that band of support, the chart keeps its sideways-to-firmer structure intact. If it slips below it, the stock would be signaling that the rebound has lost traction and that the lower part of the range near 136.44 could come into view.
The setup is balanced, but not symmetrical.
Technical Verdict: HOLD (wait & see)
HOLD (wait & see)
- Reason 1: Price is above the SMA20 and SMA50, which keeps the broader structure constructive even though the trend is still sideways.
- Reason 2: MACD is negative with the histogram below zero, showing that momentum has not yet confirmed the day’s bounce.
- Reason 3: RSI and Stochastic are neutral, so the stock is neither overbought nor oversold; that usually argues for patience rather than urgency.
- Verdict invalidated if price breaks below 140.35, because that would undercut the nearest support and the area around the SMA50 at 140.93.
- Ideal Entry Range: 140.35 to 149.13
- Exit Target: 161.83 to 162.52
- Stop Loss protection: below 136.44
For non-traders, this means Oracle is holding together, but the chart still needs stronger proof before the move can be trusted.
“The stock is not broken, but it has not yet earned conviction.”
Summary Data ORCL
| Last price | 150.59 USD |
| Change 1 day / 5 days / 1 month | 5.19% / -1.54% / 4.71% |
| Trend / MA-cross | sideways / none |
| SMA20 / SMA50 | 149.13 / 140.93 |
| RSI (14) / Stochastic %K | 51.8 / 36.6 |
| Bollinger %B / ATR | 56% / 8.08 |
| Support / Resistance 20 days | 140.35 / 162.52 |
| Data as of | 17 September 2026 20:30 WIB |


