AIA Stock Analysis: Drops 0.78%, Golden Cross Formed
On September 21, 2026: price 76.75 HKD, trend uptrend, RSI 55.2, support 74.20, resistance 77.50. technical analysis of aia stock. AIA Stock Analysis — full…

AIA Group’s shares on HKEX slipped to HKD 76.75 from HKD 77.35, a modest 0.78% daily decline that still leaves the stock within an upward technical structure. The move matters less for the red close itself than for what sits underneath it: price remains above both short- and medium-term averages, and the chart is showing a market that is still being supported by trend rather than being driven by panic, as shown in the chart.
Trend & Price Action
The clearest signal is that AIA is trading above SMA20 at HKD 76.01 and above SMA50 at HKD 75.70, with a golden cross in place, meaning the shorter average has crossed above the longer one. In technical terms, that usually tells traders that recent buying has outpaced the slower trend, and that the market is still willing to pay up for the shares rather than fading rallies. The uptrend is also backed by the SMA20 slope of 1.05% over five days, which suggests the near-term trend is not flat but still rising.
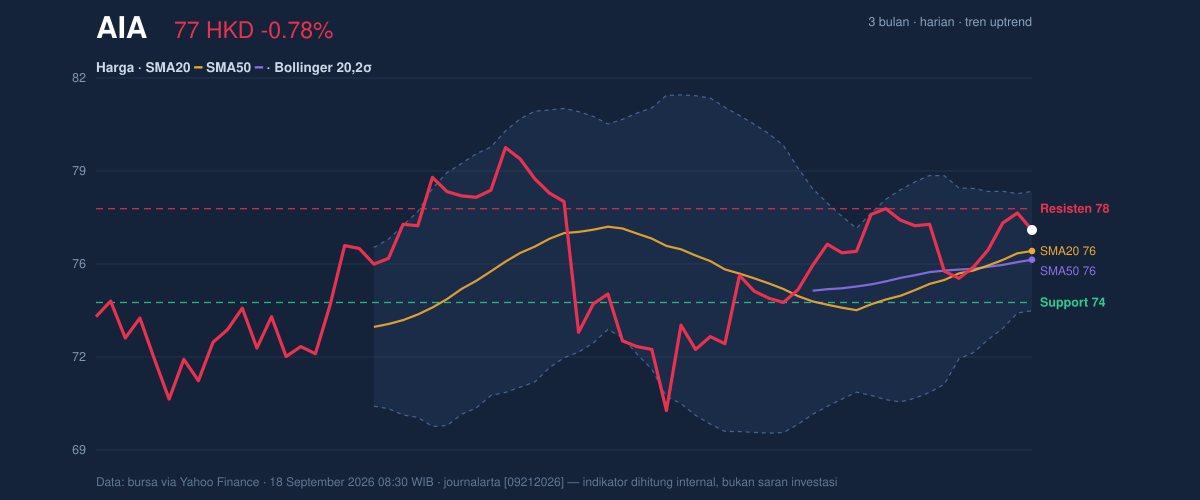
The stock is also sitting at 77% of its 20-hour range, with support at HKD 74.20 and resistance at HKD 77.50. That positioning is important. It says the market is not languishing near the lows of the range, but it is also pressing into an area where sellers have recently shown up. The broader three-month frame reinforces that read: the shares are below the 3-month high of HKD 80.15 but well above the 3-month low of HKD 69.35, leaving room for either continuation or rejection depending on whether buyers can absorb supply near the upper band.
Oscillators & Momentum
Momentum is constructive, but not stretched. The RSI at 55.2 is neutral, which means the stock is neither overbought nor oversold; it is in the middle zone where trends can continue without immediate exhaustion. The Stochastic %K at 63.1 and %D at 68.2 is also neutral, though %K sitting below %D hints that the short-term pace has cooled a little. That does not negate the trend, but it does say the latest push is not yet being confirmed by a fresh acceleration in momentum.
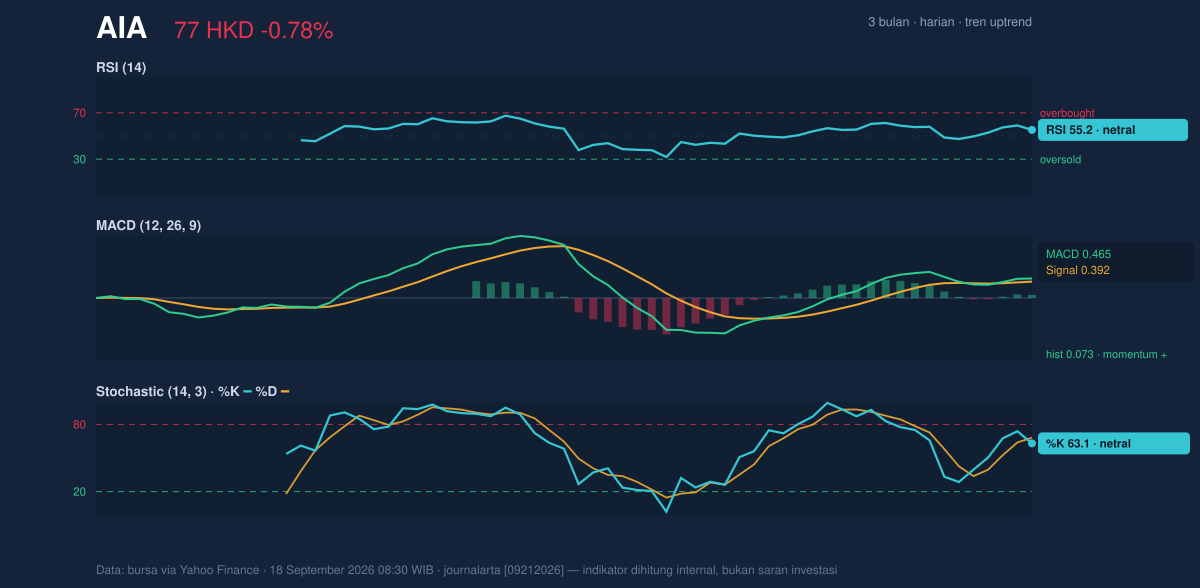
The stronger message comes from the MACD at 0.465 versus its signal line at 0.392, with a positive histogram of 0.073. In plain language, the trend engine is still running above zero, and the gap between MACD and signal says buying pressure is still slightly ahead of selling pressure. When MACD is positive while RSI remains neutral, it often means a stock has room to extend without already being overheated. That is a healthier setup than a momentum surge that arrives only after the chart is already extended.
Volatility & Volume
Bollinger Bands are adding an important nuance. The stock is trading near the middle-to-upper part of the band structure, with the upper band at HKD 78.11, the middle band at HKD 76.01, and the lower band at HKD 73.91. The %B reading of 68% shows price is above the midline but not yet pressing the top of the band. More telling is the 5.5% band width, which is narrowing. A squeeze like this usually means volatility has contracted and the market is storing energy for a larger move. That move can be upward or downward, but in the context of the golden cross and positive MACD, the current bias leans toward an upside attempt if resistance gives way.
Volatility is not excessive. The ATR at 1.56, or 2.0% of price, points to moderate day-to-day movement rather than a disorderly tape. That matters because a squeeze with moderate ATR often precedes a directional break rather than a chaotic spike.
Volume, however, is the one caution flag in the setup. Trading volume reached 56,369,948, about 2.1× the 20-day average of 27,329,102. That is a strong participation signal and usually suggests the latest move is being actively traded, not ignored. But OBV is down, which means the volume trend has not fully confirmed price strength. In simple terms, the market is seeing heavy activity, but the balance of that activity has not yet translated into steadily improving accumulation. That divergence is worth watching because rallies with rising volume but falling OBV can stall if the buying is not persistent.
Key Levels & Scenarios
The immediate technical test is straightforward: HKD 77.50 resistance is the first line that needs to be cleared for the chart to show better upside traction. A move through that level would put the HKD 78.11 upper Bollinger band and then the HKD 80.15 three-month high back into focus. On the downside, HKD 76.01 is the first support to defend because it matches the SMA20 and the Bollinger midline. If that fails, the next technical cushion sits at HKD 74.20, which is the 20-hour support and a more meaningful line for trend preservation. A break below that would weaken the current bullish structure and raise the odds that the squeeze resolves lower instead of higher.
Technical Verdict: HOLD (wait & see)
HOLD (wait & see) is the cleanest reading because the chart is constructive, but not yet decisive enough to call a breakout.
- Golden cross and price above SMA20/SMA50 support the trend.
- MACD is positive, but RSI and Stochastic are neutral, so momentum is not fully confirmed.
- Bollinger Bands are squeezing, which often precedes a break, but direction is not yet proven.
- Verdict invalidated if price falls below HKD 74.20, where short-term support and the trend cushion sit.
- Ideal Entry Range: HKD 76.01 to 77.50
- Exit Target: HKD 78.11, then HKD 80.15
- Stop Loss protection: below HKD 74.20
For non-traders, this means the stock still looks technically healthy, but it is waiting for a clearer move before the next direction becomes obvious.
AIA’s latest recorded volume was 56,369,948 shares versus a 20-day average of 27,329,102.
Summary Data AIA
| Last price | 76.75 HKD |
| Change 1 day / 5 days / 1 month | -0.78% / 2.27% / 2.13% |
| Trend / MA-cross | uptrend / golden |
| SMA20 / SMA50 | 76.01 / 75.70 |
| RSI (14) / Stochastic %K | 55.2 / 63.1 |
| Bollinger %B / ATR | 68% / 1.56 |
| Support / Resistance 20 days | 74.20 / 77.50 |
| Data as of | 18 September 2026 08:30 WIB |



