Testing Support Level, Tencent Stock Drops 1.64% Today
On September 21, 2026: price 419.00 HKD, trend downtrend, RSI 37.0, support 419.00, resistance 455.20. technical analysis of tencent stock.

Tencent Holdings fell on the Hong Kong exchange on 18 September as 0700.HK closed at 419.00 HKD, down from 426.00 the previous session, extending a slide that has now reached -8.32% over the past month. The move matters because it places the stock right at the lower edge of its near-term trading range, with price action now sitting below the SMA20 at 437.42 and well under the SMA50 at 452.50, a configuration that usually tells traders the burden of proof has shifted to the bulls. As shown in the chart, Tencent is no longer merely drifting under short-term averages; it is pressing against a level that has become both a floor and a warning line.
Trend & Price Action
The broader message from the chart is still bearish. The stock is in a downtrend, and the SMA20 slope of -1.09% over 5 days shows the short-term average is still rolling lower rather than flattening out. That is important because a falling moving average often acts like a moving ceiling: rallies can stall there even before they reach the more distant SMA50. The lack of a fresh MA-cross also matters. In plain terms, there is no new crossover signal suggesting that short-term momentum has begun to overtake the longer trend. The price is also pinned at the very bottom of its 20-hour support at 419.00, which means the market is testing whether recent sellers have exhausted themselves or whether the next leg lower is already being prepared.
The 3-month range adds context. Tencent has moved from a 3-month high of 497.80 to a 3-month low of 411.00, and the latest close leaves it only a short distance above that floor. That is not just a statistic; it signals that the stock is trading in the lower third of its recent range, where sentiment is usually fragile and rebounds need confirmation rather than assumption.
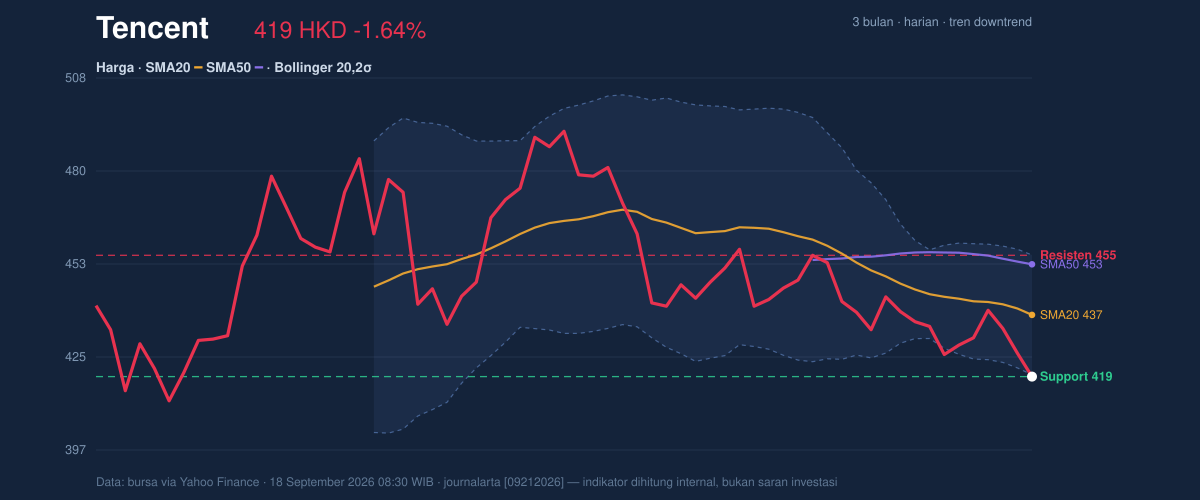
A short line on the chart tells the story: price is weak, but the nearest support is still close enough to matter.
Oscillators & Momentum
The momentum picture is mixed, but not in a reassuring way. RSI(14) at 37.0 is technically neutral, which means the stock is not yet in a classic oversold reading. However, the more sensitive Stochastic %K at 0.0 and %D at 16.9 shows the stock is deeply oversold in the short term. That combination often appears when a decline has stretched far enough to attract bargain-hunting, but it does not guarantee a reversal. It simply says downside pressure may be getting tired. The catch is the MACD at -7.217, still below the signal line at -6.244, with a -0.973 histogram. That negative spread means momentum remains pointed downward even as the stock approaches support. In other words, the oscillator setup is flashing “stretched,” but not yet “repaired.”
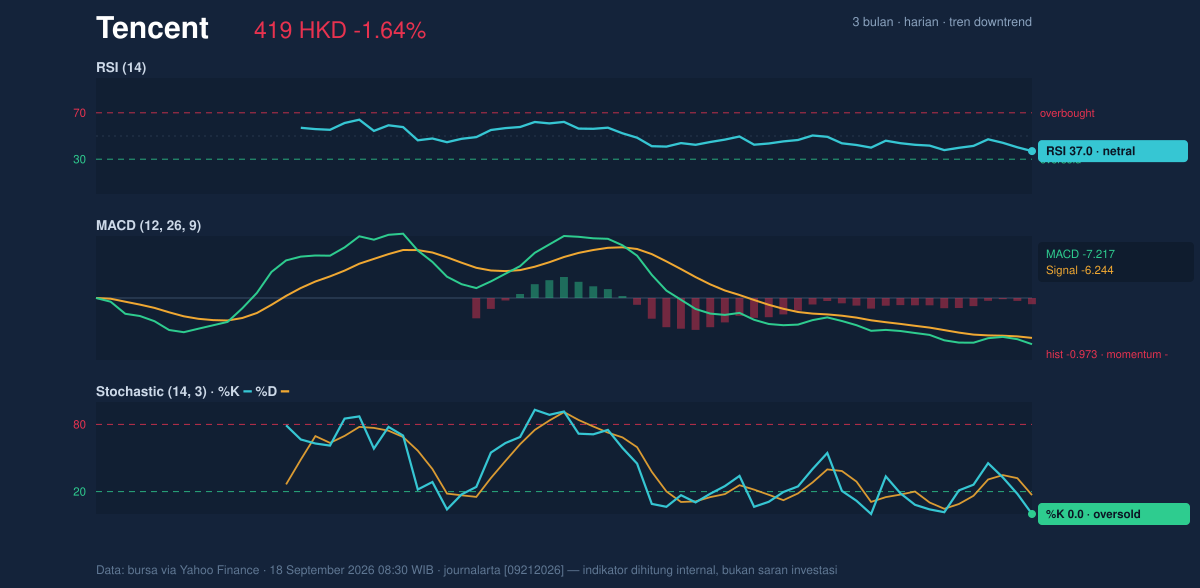
As shown in the momentum chart, the oversold Stochastic is the clearest early warning that selling may be overextended — but MACD has not turned to confirm a turn.
Volatility & Volume
Volatility is present, but not extreme. The ATR(14) of 9.79, equal to 2.3% of price, suggests a session can still move enough to matter, though not in a disorderly way. Bollinger Bands reinforce that view. Price is sitting at the lower edge of the band structure, with the lower band at 419.56 and the close at 419.00, which places the stock just beneath the band floor and gives the reading a mildly stressed tone. The %B at -2% is a useful signal here: it means price has slipped outside the expected band range, a condition that often reflects short-term exhaustion, but also confirms that the stock is under pressure. The band width of 8.2% is described as normal, so this is not a volatility breakout environment; it is more of a controlled drift lower with occasional sharp reactions.
Volume strengthens the bearish case. The latest session traded 28,796,138 shares, about 1.6× the 20-hour average of 18,328,216. That kind of lift in turnover usually means the move is not random noise. When volume expands on weakness, it often signals active distribution — investors are selling into the decline rather than passively waiting. The fact that OBV is falling supports that read: on-balance volume tracks whether volume is accumulating behind price or leaving it, and here it is leaving.
Key Levels & Scenarios
The immediate level to watch is the 419.00 support, which is also where the stock closed. That makes the line especially important because a daily close below a support level is more meaningful than an intraday dip. If that floor fails, the next reference point from the data is the 3-month low at 411.00. On the upside, the first barrier is the 20-hour resistance at 455.20, closely aligned with the Bollinger upper band at 455.28. That overlap makes the zone technically important: it is where any rebound would likely face selling pressure, especially while the stock remains below the SMA20 at 437.42 and SMA50 at 452.50.
The setup therefore looks like a range test inside a weakening trend. If the stock can reclaim the lower Bollinger band and then the SMA20, it would suggest the recent downside stretch is easing. If it cannot, the market is likely still treating rallies as opportunities to reduce exposure rather than as proof of recovery.
Technical Verdict: HOLD (wait & see)
HOLD (wait & see)
- The trend remains down, with price below both the SMA20 at 437.42 and SMA50 at 452.50.
- Stochastic is oversold, but MACD remains negative, so momentum has not yet turned enough to confirm a durable rebound.
- Volume is 1.6× average and OBV is falling, which shows active selling pressure is still present.
Verdict invalidated if price falls below 411.00.
- Ideal Entry Range: 419.00 to 437.42, only if price stabilizes and reclaims the lower Bollinger band.
- Exit Target: 455.20 to 455.28, where resistance and the upper Bollinger band converge.
- Stop Loss: below 411.00, the 3-month low and the next clear downside reference.
For non-traders: Tencent is weak, but the stock is now close enough to support that the next move will tell us whether sellers are still in control or finally running out of steam.
“This is the point where the market decides whether the floor holds — or whether the slide is not done yet.”
Summary Data Tencent
| Last price | 419.00 HKD |
| Change 1 day / 5 days / 1 month | -1.64% / -2.19% / -8.32% |
| Trend / MA-cross | downtrend / none |
| SMA20 / SMA50 | 437.42 / 452.50 |
| RSI (14) / Stochastic %K | 37.0 / 0.0 |
| Bollinger %B / ATR | -2% / 9.79 |
| Support / Resistance 20 days | 419.00 / 455.20 |
| Data as of | 18 September 2026 08:30 WIB |



