HSBC Testing Support Level: Stock Gains 1.13% (September 21, 2026)
On September 21, 2026: price 161.60 HKD, trend sideways, RSI 48.4, support 159.60, resistance 167.60. technical analysis of hsbc stock.

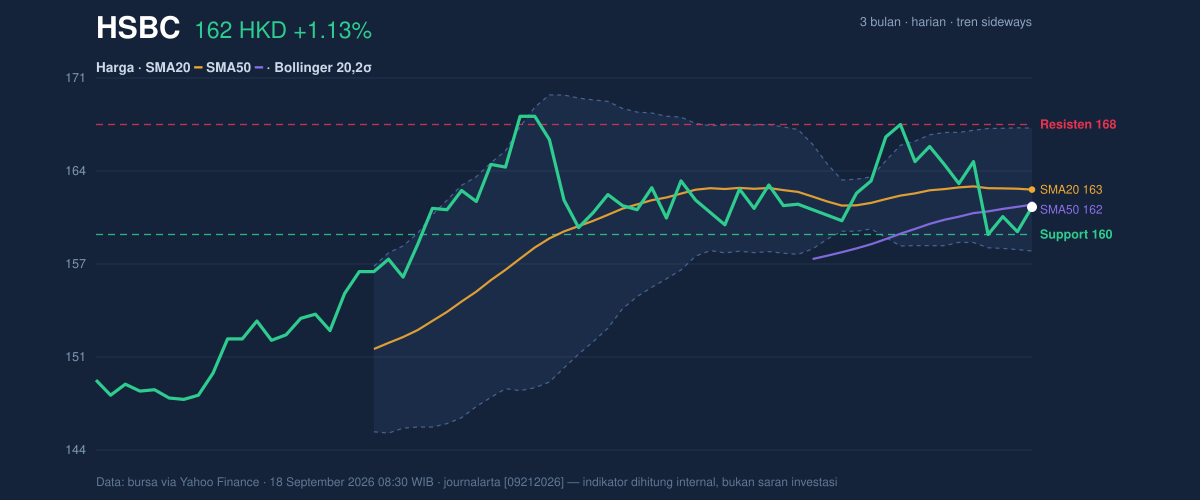
HSBC Holdings (0005.HK) rose to HKD 161.60 on 18 September 2026, up 1.13% from the previous close of 159.80, but the move still leaves the stock below its 20-day average of 162.87 and only slightly above the 50-day average of 161.77. That positioning matters: it suggests the latest bounce is happening inside a broader sideways phase rather than a clean trend reversal, with the chart showing price near the lower half of its recent range and momentum still mixed, as shown in the chart.
Trend & Price Action
The setup is best described as a market that has not yet chosen a direction. The SMA20 is 162.87 and is sloping down by -0.10% over 5 days, while price remains below the SMA20. That combination usually signals that short-term sellers still have the upper hand, even if the decline is not aggressive. The fact that there is no new MA-cross also matters: moving-average crossovers often mark a shift in trend, and the absence of one suggests the stock is still drifting rather than transitioning decisively.
At the same time, HSBC is not breaking down in a straight line. The share price is sitting above the 3-month low of 145.40 and below the 3-month high of 169.70, which places it in the middle of a broad trading band. That is classic range behavior: buyers and sellers are active, but neither side has forced a lasting break. The 20-hour support at 159.60 is close enough to matter, because price is only a little above it; the 20-hour resistance at 167.60 remains the first obvious ceiling.
The chart points to a market waiting for confirmation, not one already in a trend.
Oscillators & Momentum
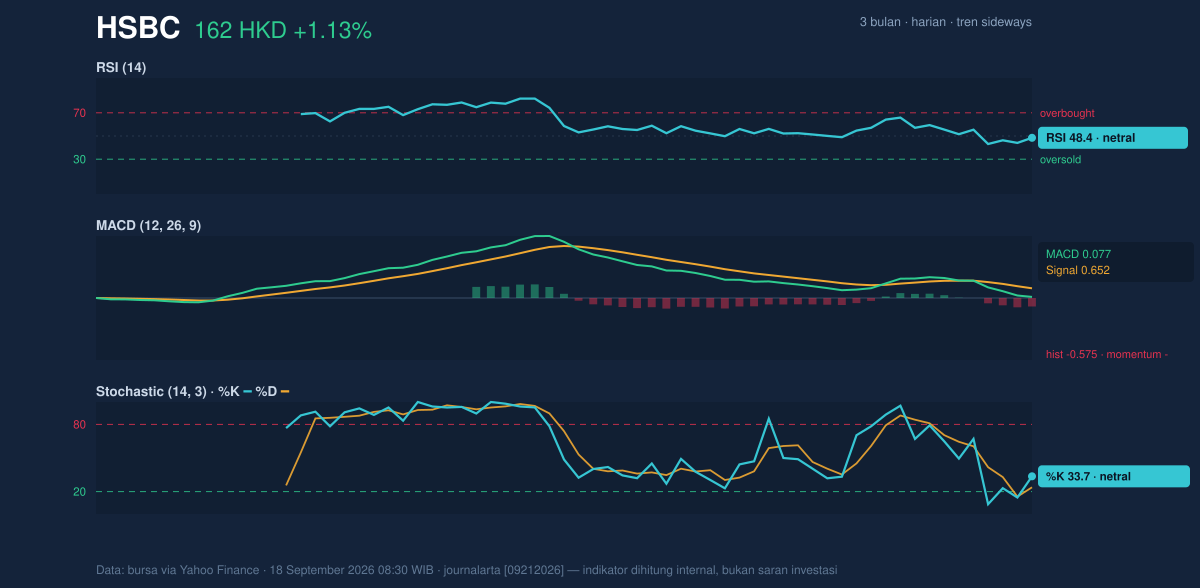
The momentum tools are neutral to slightly cautious. RSI at 48.4 sits almost exactly in the middle of the scale, which means the stock is neither stretched upward nor oversold. In plain English, there is no strong momentum crowding on either side. The Stochastic %K at 33.7 and %D at 23.8 also point to a market that is recovering from weaker levels but has not yet built enough thrust to confirm a breakout. Stochastic is useful for spotting turning points inside ranges, and here it suggests the stock may be trying to lift, though not with conviction.
The clearest warning comes from MACD at 0.077 versus its signal line at 0.652, with the histogram at -0.575. MACD compares short-term and medium-term price momentum; when the histogram is negative, it means the shorter-term pace is still lagging the longer-term trend reading. So even though the price ticked higher on the day, the underlying momentum has not yet fully turned positive. That is the kind of divergence traders watch when a bounce looks real on the surface but still needs confirmation.
RSI is neutral, Stochastic is recovering, and MACD is still negative.
Volatility & Volume
Volatility is present, but not extreme. ATR(14) is 2.80, or 1.7% of price, which indicates a moderate daily swing range. That matters because it defines how easily the stock can move through nearby support or resistance without needing a major catalyst. More interesting is the Bollinger setup: the upper band is 167.34, the middle band is 162.87, and the lower band is 158.39, with %B at 36% and the band width at 5.5%. A narrow band width suggests a squeeze, which often precedes a larger move. In other words, the chart is compressing rather than expanding, and compressed charts tend to resolve with sharper direction once price escapes the range.
Volume gives the move some credibility, but not enough to call it decisive. 12,240,089 shares traded versus a 20-day average of 10,255,450, or about 1.2 times normal. That tells us the day’s rebound drew better-than-average participation, which is constructive. The OBV is rising as well, and OBV tracks whether volume is flowing into or out of the stock; a rising line generally means buyers are accumulating more than sellers are distributing. Still, because price remains below the short-term average and MACD is negative, the volume confirmation is supportive rather than conclusive.
The squeeze is the key signal: a quiet chart now, but one that can move quickly once it leaves the bands.
Key Levels & Scenarios
The immediate map is straightforward. Support at 159.60 is the first level to watch, followed by the lower Bollinger band at 158.39. If price holds above that zone, the market can continue to trade as a shallow consolidation with a mild recovery bias. If it fails, the chart would be signaling that the recent bounce has lost traction and that sellers are regaining control.
On the upside, resistance at 167.60 aligns closely with the Bollinger upper band at 167.34, making that area a meaningful test. A push through that cluster would suggest the squeeze is resolving upward and that the stock is attempting to reclaim the upper half of its recent range. The next reference point after that is the 3-month high of 169.70, which marks the top of the broader band.
The stock is boxed in between 159.60 and 167.60, with the Bollinger bands tightening around that range.
Technical Verdict: HOLD (wait & see)
HOLD (wait & see) is the clearest reading from the current technical mix.
- RSI at 48.4 is neutral, so there is no strong momentum case either way.
- MACD histogram at -0.575 remains negative, meaning the rebound has not yet been confirmed by momentum.
- Bollinger bands are squeezing and volume is above average, which raises the chance of a directional break but does not say which side will win.
This verdict is invalidated if price breaks below 158.39, because that would put the stock under the lower Bollinger band and weaken the current range floor.
- Ideal entry range: 159.60 to 162.87
- Exit target: 167.34 to 167.60
- Stop loss protection: below 158.39
For non-traders, this means HSBC’s chart is not showing a clear winner yet, but it is close to a level where the next move could become more decisive.
12,240,089 shares changed hands, against a 20-day average of 10,255,450.
Summary Data HSBC
| Last price | 161.60 HKD |
| Change 1 day / 5 days / 1 month | 1.13% / -1.04% / -0.80% |
| Trend / MA-cross | sideways / none |
| SMA20 / SMA50 | 162.87 / 161.77 |
| RSI (14) / Stochastic %K | 48.4 / 33.7 |
| Bollinger %B / ATR | 36% / 2.80 |
| Support / Resistance 20 days | 159.60 / 167.60 |
| Data as of | 18 September 2026 08:30 WIB |



