Alibaba Stock Technicals Today: Gains 4.00%, Momentum Weakens
On September 21, 2026: price 109.30 HKD, trend downtrend, RSI 45.9, support 105.10, resistance 116.60. technical analysis of alibaba stock.

Alibaba Group’s Hong Kong-listed shares rose to HKD 109.30 in the latest session on HKEX, rebounding 4.00% from the previous close of HKD 105.10, but the move still sits inside a broader downtrend and below the key short- and medium-term averages, according to exchange data and chart indicators. The price is now trading below the SMA20 at HKD 110.09 and well under the SMA50 at HKD 115.42, which matters because it shows the rebound has not yet changed the underlying structure: sellers remain in control unless the stock can reclaim those moving averages with follow-through. The chart also places Alibaba in the lower half of its recent trading band, with the latest price around 37% of the 20-hour range, a sign that the stock has recovered from weakness but has not yet repaired it.
Trend & Price Action
The most important signal here is not the one-day gain; it is the fact that the share price is still sitting under both major short-term trend markers. A stock trading below the SMA20 and SMA50 typically means recent buying has not been strong enough to reverse the prior decline. The SMA20 slope of -3.87% over five days reinforces that message: the short-term trend is still pointing down, even if the latest session looked firmer. That is why the bounce should be read as a recovery attempt rather than a confirmed turn.
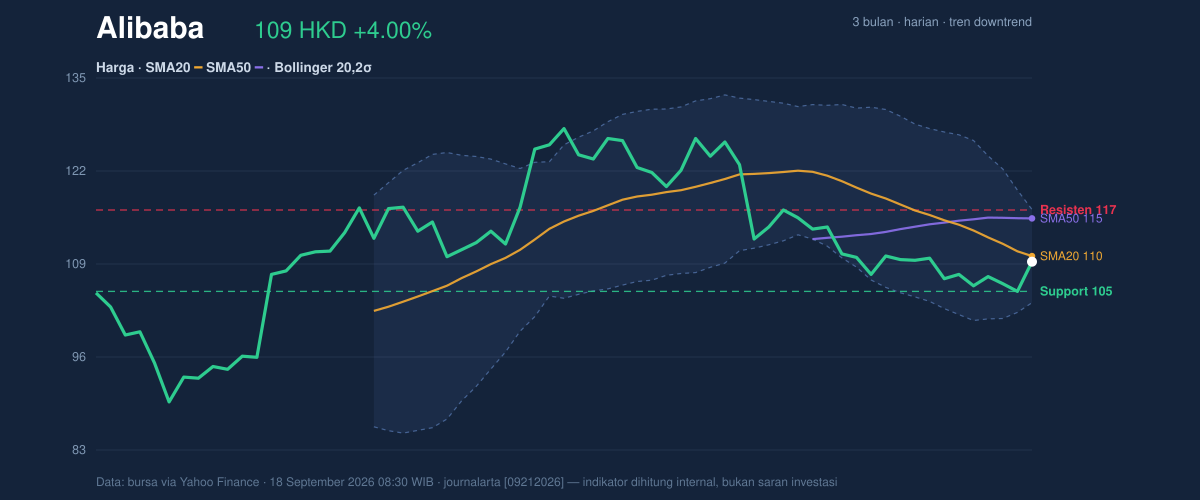
The broader range gives that weakness context. Alibaba’s 3-month high of HKD 130.30 and 3-month low of HKD 88.65 frame a market that has already absorbed a meaningful drawdown, but the current level remains much closer to the lower end than the peak. The nearest visible floor is the 20-hour support at HKD 105.10; losing that zone would expose the stock to a retest of the lower Bollinger band at HKD 103.51. On the upside, the first hurdle is the 20-hour resistance at HKD 116.60, closely followed by the SMA50 at HKD 115.42 and the upper Bollinger band at HKD 116.67. When several resistance markers cluster together, they often act like a ceiling until momentum improves.
A rebound is only meaningful if it can get through that ceiling.
Oscillators & Momentum
Momentum indicators are still mixed rather than decisive. The RSI at 45.9 is neutral, which means the stock is neither stretched on the downside nor overbought on the upside. That is important because it suggests the recent bounce does not yet have the kind of momentum exhaustion that often precedes a sharp reversal. At the same time, neutral RSI also means there is no strong momentum tailwind behind the move.
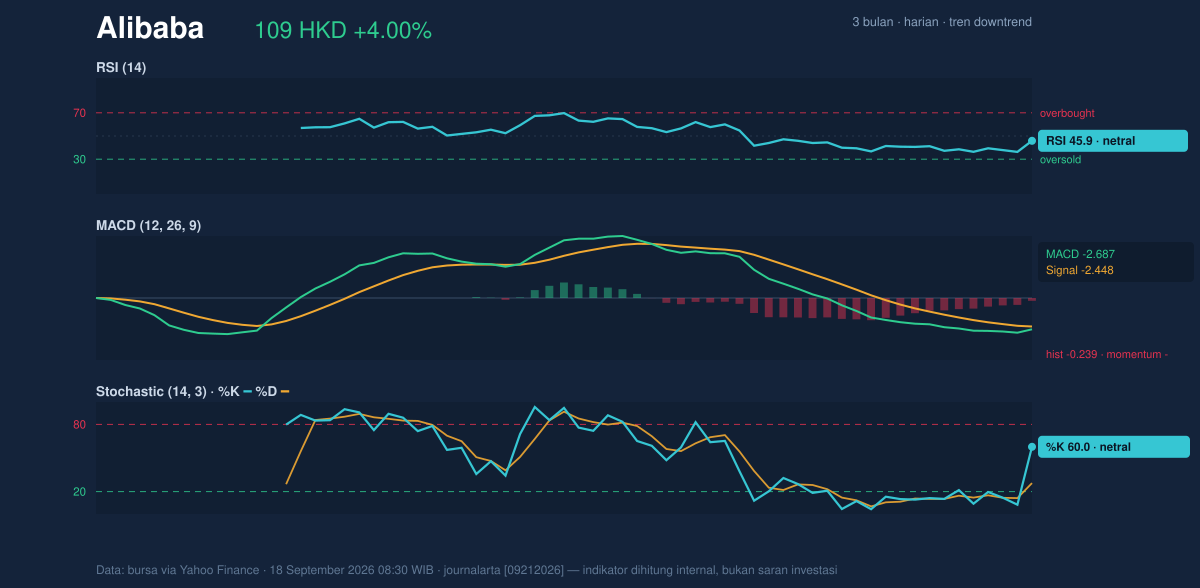
The Stochastic oscillator is also neutral, with %K at 60.0 and %D at 27.6. In plain terms, the faster line is above the slower line, which can hint at improving short-term momentum, but the reading is not strong enough to call a clean bullish breakout. More telling is the MACD at -2.687 versus the signal line at -2.448, leaving the histogram at -0.239. Because MACD remains below its signal line and below zero, the trend impulse is still negative. That usually means rallies can be sold into unless price action starts to improve first.
So the oscillators are not flashing panic, but they are not confirming strength either.
Volatility & Volume
Volatility is moderate rather than explosive. The ATR(14) at 3.31, equal to about 3.0% of price, suggests the stock can still move enough in a day to test nearby support or resistance, but not in a disorderly way. The Bollinger Bands are also useful here: the band width of 12.0% is described as normal, which means the market is not in a squeeze that would usually precede a sharp breakout, nor is it in an unusually wide, panic-driven swing. The %B at 44% shows price sitting below the middle band at HKD 110.09, again consistent with a market that is still trying to stabilize rather than break free.
Volume gives a similar read. Last session’s volume of 90,084,892 was close to the 20-hour average of 86,676,427, so the rebound was not driven by a dramatic surge in participation. That matters because strong trend reversals often need a clear pickup in trading activity to prove conviction. The fact that OBV is falling — on-balance volume, a measure that tracks whether volume is flowing into or out of a stock — indicates that the broader accumulation pattern is still weak. In other words, the market may be bouncing, but it has not yet shown that large buyers are stepping in decisively.
Technical Verdict: HOLD (wait & see)
HOLD (wait & see)
- MACD remains negative and below its signal line, which means downside momentum has not fully cleared.
- Price is below SMA20 and SMA50, so the chart still sits under the main trend filters.
- RSI and Stochastic are neutral, showing stabilization, but not enough strength to confirm a trend reversal.
Verdict invalidated if price breaks below HKD 105.10, because that would put the stock back under the nearest support and expose the lower Bollinger band at HKD 103.51.
- Ideal Entry Range: HKD 105.10 to 110.09
- Exit Target (Target Price): HKD 115.42 to 116.67
- Stop Loss protection: HKD 103.51
In plain English: Alibaba’s Hong Kong shares have bounced, but the chart still needs proof that the recovery is real, not just a short-lived rebound.
Summary Data Alibaba
| Last price | 109.30 HKD |
| Change 1 day / 5 days / 1 month | 4.00% / 1.67% / -11.14% |
| Trend / MA-cross | downtrend / none |
| SMA20 / SMA50 | 110.09 / 115.42 |
| RSI (14) / Stochastic %K | 45.9 / 60.0 |
| Bollinger %B / ATR | 44% / 3.31 |
| Support / Resistance 20 days | 105.10 / 116.60 |
| Data as of | 18 September 2026 08:30 WIB |



