AMAT Stock Gains 6.51%, Momentum Gains In Focus
On September 21, 2026: price 444.57 USD, trend downtrend, RSI 43.4, support 415.38, resistance 492.32. technical analysis of amat stock.

Applied Materials is still trading inside a weak tape, but the latest session showed a sharp rebound that may be more about volatility than a clean trend change. The stock closed at 444.57 USD on Nasdaq, up 6.51% from the previous close of 417.40, yet it remains below its short- and medium-term trend markers, which keeps the burden of proof on the bulls.
Trend & Price Action
As shown in the chart, AMAT sits below its SMA20 at 454.23 and well beneath the SMA50 at 501.12, a structure that still points to a broader downtrend. The slope of the SMA20 at -4.48% over 5 days matters because it shows the recent average price is still rolling lower, even after the day’s bounce. That is the difference between a one-day recovery and a genuine trend reversal: the latter usually needs price to reclaim the short average and hold it.
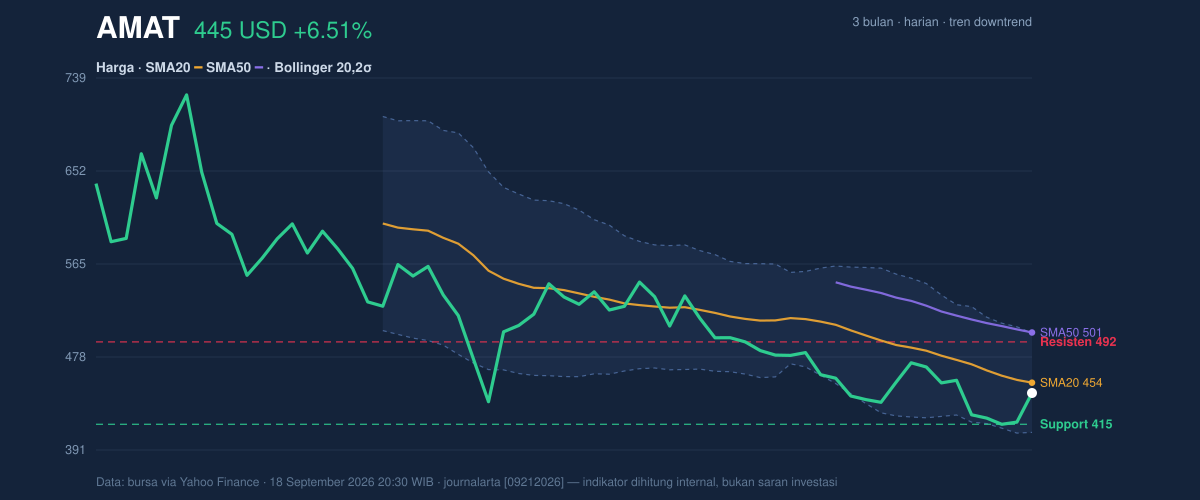
The stock is also trading in the lower half of its recent band, with price at 38% of the 20-hour range between support at 415.38 and resistance at 492.32. That positioning says the market has recovered from stress, but not enough to prove control has changed hands. The 3-month low at 411.51 sits close to support, which makes that area important: if it fails, the chart loses one of its last visible floors.
Oscillators & Momentum
Momentum is mixed rather than decisively bearish. The RSI at 43.4 is neutral, meaning the stock is neither oversold nor overbought, while the Stochastic %K at 52.9 and %D at 22.3 suggests the short-term bounce has room to continue but has not yet confirmed a strong trend. In plain language, the oscillator setup says the rebound is alive, but not yet convincing enough to call it a new leg higher.
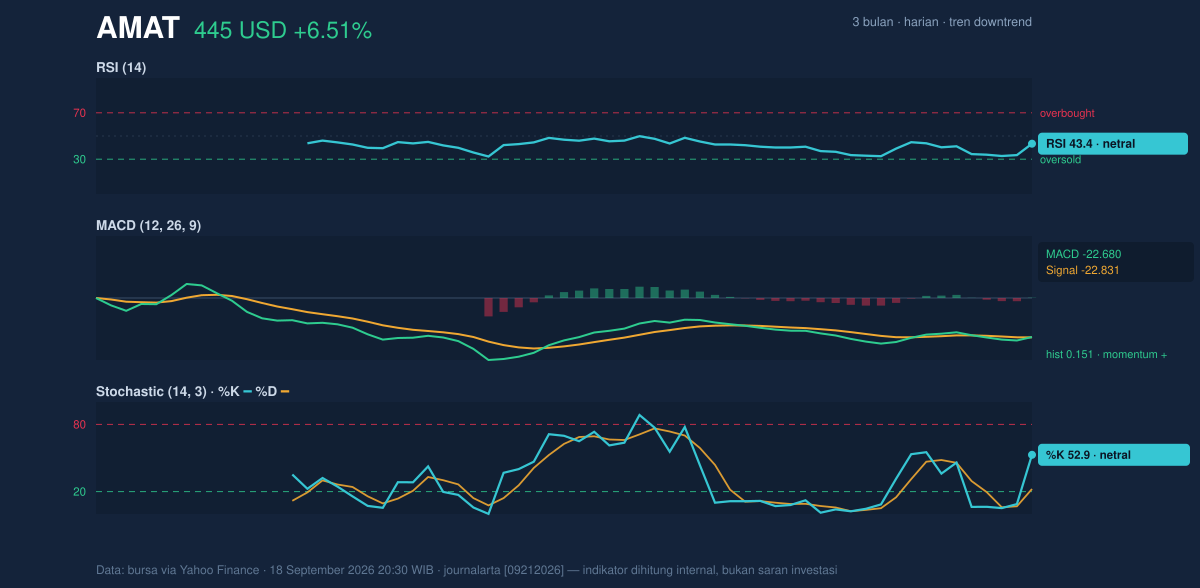
The more encouraging signal is the MACD at -22.680, which is still below zero but now sits above its signal line at -22.831, leaving a positive histogram of 0.151. That usually means downside momentum is easing and a recovery attempt is gaining traction. It does not erase the downtrend, but it does explain why the stock could bounce even while the larger structure remains weak.
Volatility & Volume
The volatility backdrop is unusually active. Bollinger Bands show the upper band at 500.67, the middle band at 454.23, and the lower band at 407.78, with %B at 40% and the band width at 20.4%. A widening band is important because it signals the market is preparing for larger swings, not settling into calm trading. In this case, the move lower has been volatile, and the rebound may also be sharp, but not necessarily durable.
The ATR at 17.76, equal to 4.0% of the share price, reinforces that point. ATR measures the average daily movement range, so a high reading means traders should expect bigger intraday and day-to-day swings. Volume adds another layer: the latest session printed 14,276,700 shares, about 2.2 times the 20-hour average of 6,480,975, while OBV is rising. That combination usually means the move had participation behind it, not just thin trading. Still, volume alone cannot override a downtrend; it can only tell us the rebound has attracted attention.
Key Levels & Scenarios
The nearest support to watch is 415.38, with the broader 3-month low at 411.51 just beneath it. If AMAT holds above that zone, the recent bounce can keep trying to work its way back toward the 454.23 SMA20, which is also the Bollinger middle band. If it fails, the chart would likely shift back into a more defensive posture, because the market would be testing fresh lows rather than repairing the trend.
On the upside, 454.23 is the first technical hurdle, followed by 492.32 resistance. A move through that ceiling would matter because it would place price back above the recent range boundary and start to challenge the idea that the stock is locked in a downtrend. The upper Bollinger band at 500.67 then becomes the next visible reference, but only if the stock can first reclaim the middle band and hold it.
Technical Verdict: HOLD (wait & see)
HOLD (wait & see) — the chart shows a rebound, but not yet enough evidence of a trend reversal.
- Reason 1: Price is still below the SMA20 at 454.23 and far under the SMA50 at 501.12, so the broader structure remains weak.
- Reason 2: MACD is improving with a positive histogram, which supports the bounce, but it is still below zero, so momentum has not fully turned bullish.
- Reason 3: Volume surged to 2.2× average and OBV is rising, showing participation, while Bollinger bands are widening, which keeps volatility elevated and makes confirmation more important than enthusiasm.
- Invalidation: this verdict is invalidated if price falls below 415.38, with the 411.51 3-month low acting as the deeper line in the sand.
- Ideal entry range: 415.38 to 454.23, where support and the SMA20 overlap.
- Exit target: 492.32, the next clear resistance.
- Stop loss protection: below 411.51, to guard against a renewed breakdown.
For non-traders, this means the stock has stopped falling for now, but it has not yet proved that the downtrend is over.
“The market is still asking AMAT to prove itself, and until it does, every bounce carries the weight of a test.”
Summary Data AMAT
| Last price | 444.57 USD |
| Change 1 day / 5 days / 1 month | 6.51% / -2.61% / -10.41% |
| Trend / MA-cross | downtrend / none |
| SMA20 / SMA50 | 454.23 / 501.12 |
| RSI (14) / Stochastic %K | 43.4 / 52.9 |
| Bollinger %B / ATR | 40% / 17.76 |
| Support / Resistance 20 days | 415.38 / 492.32 |
| Data as of | 18 September 2026 20:30 WIB |



