KO Stock Gains 0.22%, Testing Support Level In Focus
On September 21, 2026: price 88.25 USD, trend sideways, RSI 51.0, support 87.55, resistance 91.99. technical analysis of ko stock. KO Stock Gains — full…

Coca-Cola’s shares ended at 88.25 on 18 September 2026, up 0.22% on the day, but the more important signal is that the stock is still trading below its 20-day average of 88.98 while holding above the 50-day average of 87.05. That combination usually reads as a market that has not broken down, but has not yet reclaimed near-term control either: the longer trend is intact enough to prevent panic, yet short-term buyers have not forced a decisive move back above the recent mean. The result is a sideways tape with a slight downward tilt, exactly the kind of setup that can look quiet until it isn’t.
Trend & Price Action
The chart shows price sitting in the upper half of its recent structure but still short of the level that would matter most for a cleaner recovery: the 20-day SMA at 88.98. The stock’s sideways trend is backed by the SMA20 slope of -0.12% over 5 days, a mild negative drift that says momentum has softened without collapsing. That matters because a flat-to-down slope often signals indecision rather than conviction; sellers are present, but they are not forcing a trend break.
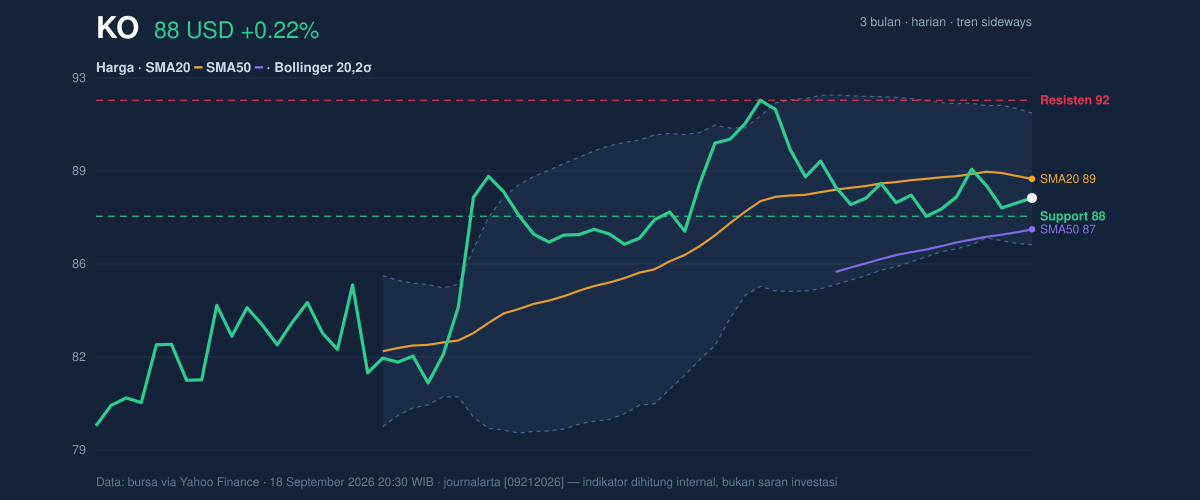
The broader range also frames the move. With the 20-hour support at 87.55 and 20-hour resistance at 91.99, the current price is sitting around the middle-lower portion of the range, at roughly 16% of that band from the bottom. In plain terms, the stock is not pressing the ceiling, but it is not testing the floor either. The 3-month high of 92.49 and 3-month low of 79.06 show there is still room above if the market can build momentum, yet the recent failure to reclaim the upper band suggests traders remain selective.
A short-term bounce is possible. A clean trend change is not yet confirmed.
Oscillators & Momentum
Momentum indicators are broadly neutral, but they are not telling the same story. The RSI at 51.0 is almost textbook neutral, which means the stock is neither stretched nor washed out. That usually leaves room for either direction, but it also means price action must do the heavy lifting. The Stochastic %K at 28.5 and %D at 22.0 sit in a low zone without being deeply oversold, which often points to a market that has cooled enough to stabilize but has not yet produced a strong reversal signal.
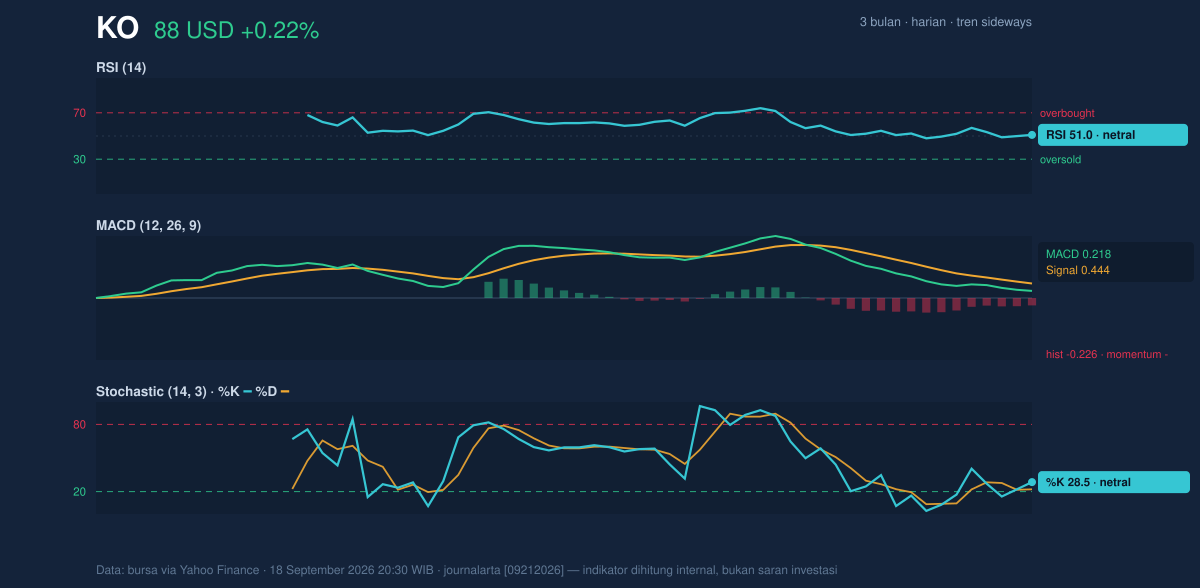
The more cautionary read comes from MACD. With MACD at 0.218, signal at 0.444, and a histogram of -0.226, the short-term trend is lagging its own signal line. That negative histogram is important because it shows momentum has weakened even while price has avoided a sharp drop. In other words, the stock is holding up better than its internal momentum would suggest. That kind of divergence often precedes either a rebound or another period of drift; it does not, by itself, confirm direction.
Volatility & Volume
Bollinger Bands add another layer to the setup. The shares are trading between the band edges, with the upper band at 91.50, the middle band at 88.98, and the lower band at 86.46. The %B at 36% means price is below the midpoint of the band envelope, reinforcing the idea that the stock has not yet regained full short-term strength. More interesting is the 5.7% band width, described as a squeeze. When Bollinger bands narrow, it usually means volatility has compressed; markets often do this before a larger move, but the direction is not predictable from the squeeze alone.
The volume profile leans constructive. Last volume was 28,016,400, about 1.8× the 20-hour average of 15,678,775, and OBV is rising. That matters because rising on-balance volume suggests accumulation is occurring even without a decisive price breakout. Put simply, more shares are changing hands on the up days than the chart alone might imply. With ATR(14) at 1.21, or 1.4% of price, the stock is currently moving with relatively low day-to-day range, which fits the squeeze message: compression first, then expansion later.
The market is quiet, but it is not asleep.
Key Levels & Scenarios
The immediate technical battleground is straightforward. A move through 88.98 would put the stock back above the 20-day average and would be the first sign that near-term sellers are losing control. Above that, 91.50 and then 91.99 become the key resistance zone; a push into that area would test whether the recent volume surge was genuine accumulation or just temporary interest. On the downside, 87.55 is the first support to watch, followed by 86.46 at the lower Bollinger band. A break below that lower band would suggest the squeeze is resolving lower, not higher.
The signal is conditional rather than decisive: if price can hold above 87.55 and reclaim 88.98, the chart would begin to look less defensive; if it loses 86.46, the neutral setup would shift toward a weaker structure.
Technical Verdict: HOLD (wait & see)
HOLD (wait & see)
- RSI 51.0 is neutral, so there is no strong momentum edge.
- MACD histogram -0.226 shows momentum is still negative even as price holds above the 50-day average.
- Bollinger bands are squeezed, which often precedes a larger move, but not yet a confirmed direction.
Verdict invalidated if price falls below 86.46, because that would mean the lower Bollinger band and nearby support have failed.
- Ideal Entry Range: 87.55 to 88.98
- Exit Target: 91.50 to 91.99
- Stop Loss: below 86.46
For non-traders, this means the stock is sitting in a tight range and needs a clearer break before the next move becomes easier to read.
Summary Data KO
| Last price | 88.25 USD |
| Change 1 day / 5 days / 1 month | 0.22% / -0.05% / -2.49% |
| Trend / MA-cross | sideways / none |
| SMA20 / SMA50 | 88.98 / 87.05 |
| RSI (14) / Stochastic %K | 51.0 / 28.5 |
| Bollinger %B / ATR | 36% / 1.21 |
| Support / Resistance 20 days | 87.55 / 91.99 |
| Data as of | 18 September 2026 20:30 WIB |



