DBS Momentum Weakens: Stock Gains 0.65% (September 22, 2026)
On September 22, 2026: price 77.36 SGD, trend uptrend, RSI 56.4, support 75.65, resistance 78.65. technical analysis of dbs stock. DBS Momentum Weakens — full…

DBS Group’s shares were last at 77.36 SGD on SGX, up from the previous close of 76.86, but the more important signal is that the stock is still trading above its 20-day moving average at 77.16 and well above its 50-day average at 75.51. That keeps the short-term structure in an uptrend, even if the latest technical readings are not fully synchronized. The chart shows a stock that is holding its recent gains, but not yet breaking decisively out of its current band.
Trend & Price Action
The price sits in the upper half of its recent range, at 57% of the Bollinger band range, with the upper band at 78.67 and the lower band at 75.64. In plain terms, DBS is not stretched to the upside, but neither is it near the lower end where bargain-hunting interest often appears. The fact that the 20-day SMA is rising by 0.36% over five days suggests the trend has enough slope to remain constructive, while the wider gap above the 50-day average shows the medium-term base is still intact.
What matters here is the shape of the move, not just the level. A stock above both key averages, with a gently rising short-term average, usually signals that buyers have been willing to absorb supply on dips. But the absence of a new moving-average crossover also means this is more continuation than acceleration.
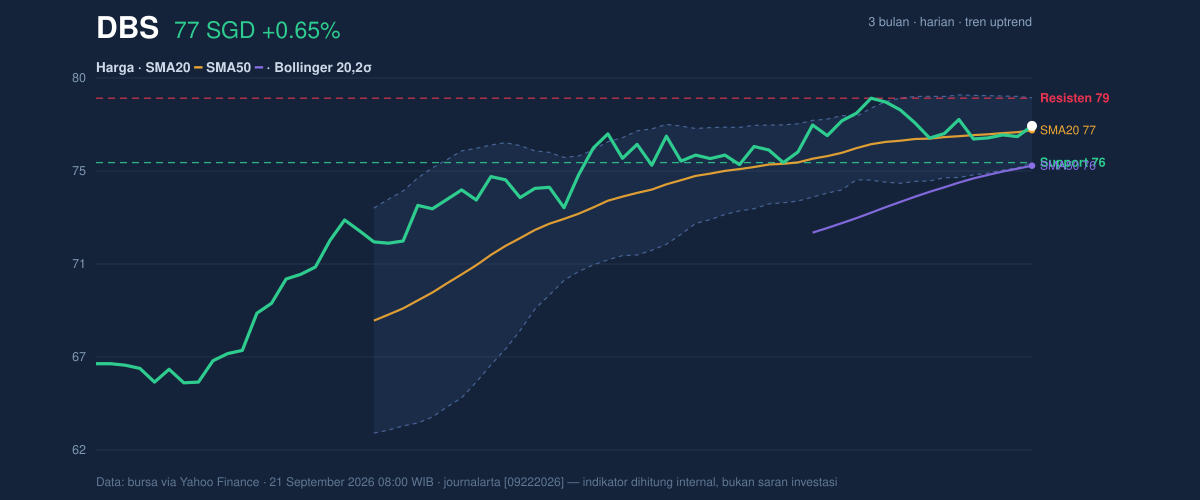
The recent range is tight: support at 75.65 and resistance at 78.65. That narrow corridor matters because a stock can look calm right before it re-prices sharply. The current setup is less about direction — which remains upward — and more about whether DBS can leave this band with conviction.
Oscillators & Momentum
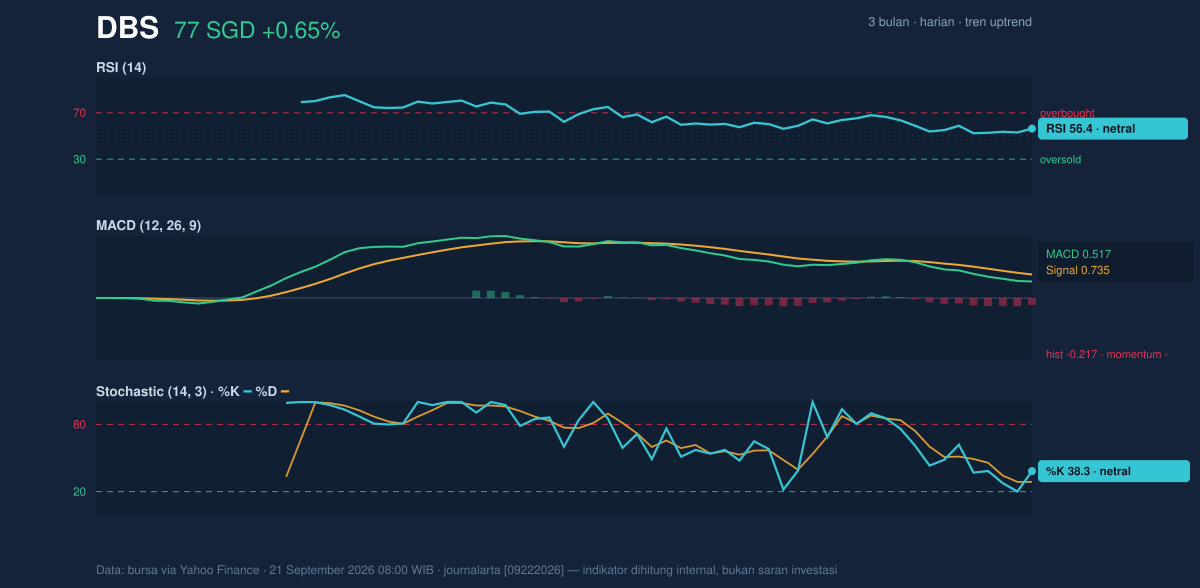
Momentum is more cautious than the trend. The RSI at 56.4 is neutral, which means the stock is neither overbought nor oversold and still has room to move without immediately hitting a technical ceiling. But the Stochastic reading of 38.3 versus 28.6 shows the stock is not yet in a strong momentum burst; it is recovering, but not forcefully. The more important warning sign is the MACD at 0.517 below its signal line at 0.735, with a -0.217 histogram. That combination says the trend is still positive on price structure, but the internal momentum has softened.
For general readers, MACD is a way of measuring whether recent price gains are speeding up or slowing down. Here, they are slowing down. That does not automatically mean a reversal, but it does mean the stock may need a fresh catalyst to push through resistance rather than simply drifting higher on inertia.
A neutral RSI with a negative MACD histogram is not a collapse signal. It is a pause signal.
Volatility & Volume
Volatility is subdued. The ATR of 0.85, equal to about 1.1% of price, indicates relatively modest day-to-day movement. That often compresses attention into a narrower range until a breakout or breakdown forces the next leg. The Bollinger band width of 3.9% is also narrowing, pointing to a squeeze — a setup that can precede expansion in either direction. In other words, the stock is coiling.
Volume does not yet confirm a breakout. Last volume was 2,870,900, below the 20-day average of 3,505,940, or about 0.8x normal. That is important because price moves with weak participation are easier to fade. The OBV is declining, which suggests the recent price firmness has not been fully backed by accumulation. When volume and price diverge like this, the move can still continue, but it usually needs stronger participation to become durable.
The chart is calm, but not fully convincing.
Key Levels & Scenarios
The nearest technical checkpoint is 78.65 resistance, just below the upper Bollinger band at 78.67. That alignment matters: if price reaches that zone, it is testing both prior supply and the statistical edge of its recent range at the same time. A clean move above it would suggest the squeeze is resolving upward. On the downside, 75.65 support sits close to the Bollinger lower band at 75.64, making that area the first line where dip buyers may try to defend the trend.
The stock is also trading below its 3-month high of 79.05, which means there is still overhead room before the chart enters fresh-high territory. At the same time, the 3-month low of 65.10 is far away, reinforcing how much of the recovery has already been repaired.
If DBS clears 78.65 with stronger participation, the chart would likely shift from range-bound to trend-extension mode. If it slips back below 75.65, the squeeze would start to look less like consolidation and more like a failed advance.
Technical Verdict: HOLD (wait & see)
HOLD (wait & see) fits best because the price trend is constructive, but momentum and volume are not yet confirming a decisive upside break.
- Reason 1: Price remains above SMA20 at 77.16 and SMA50 at 75.51, keeping the broader setup positive.
- Reason 2: MACD is below its signal line and the OBV is declining, showing the move lacks full momentum confirmation.
- Reason 3: Bollinger bands are squeezing, which often precedes a bigger move, but direction is not confirmed yet.
- Verdict invalidated if price breaks below 75.65, because that would undercut support and the lower Bollinger boundary.
- Ideal Entry Range: 75.65 to 77.16
- Exit Target: 78.65 to 78.67
- Stop Loss protection: below 75.64
For non-traders: DBS looks steady, but the next move still needs proof from volume and momentum.
Summary Data DBS
| Last price | 77.36 SGD |
| Change 1 day / 5 days / 1 month | 0.65% / -0.39% / 2.38% |
| Trend / MA-cross | uptrend / none |
| SMA20 / SMA50 | 77.16 / 75.51 |
| RSI (14) / Stochastic %K | 56.4 / 38.3 |
| Bollinger %B / ATR | 57% / 0.85 |
| Support / Resistance 20 days | 75.65 / 78.65 |
| Data as of | 21 September 2026 08:00 WIB |


