LLY Stock Gains 1.04%, Momentum Gains In Focus
On September 22, 2026: price 1,164.89 USD, trend sideways, RSI 51.3, support 1,115.70, resistance 1,246.93. technical analysis of lly stock.

Eli Lilly shares edged higher on the NYSE to US$1,164.89, up 1.04% on the day, after a session that left the stock still inside a broad sideways range rather than in a clean breakout pattern. That matters because the move came with volume at 1.0x normal, according to exchange data via Yahoo Finance, which suggests the advance was backed by real participation but not by the kind of surge that usually signals a decisive shift in trend.
Trend & Price Action
The stock is trading above its 20-day simple moving average of US$1,158.79 but below the 50-day average of US$1,176.89, a positioning that often points to a market trying to stabilize without yet reclaiming full medium-term control. In plain language, the short-term trend has improved enough to keep buyers engaged, but the longer baseline still sits overhead as a ceiling. The chart shows that the price is also sitting at roughly 37% of the way through the 20-day range, which means it is recovering from the lower half of the band but has not pushed into an area that would look like a strong trend extension.
The broader structure remains sideways, and the SMA20 slope of -1.88% over five days says the recent drift has still been slightly downward even as the latest session bounced. That combination is important: it tells readers the market is not in a freefall, but neither is it in a confirmed uptrend. The 20-day Bollinger middle band at US$1,158.79 sits almost exactly where the stock is trading, which is another sign of balance rather than conviction.
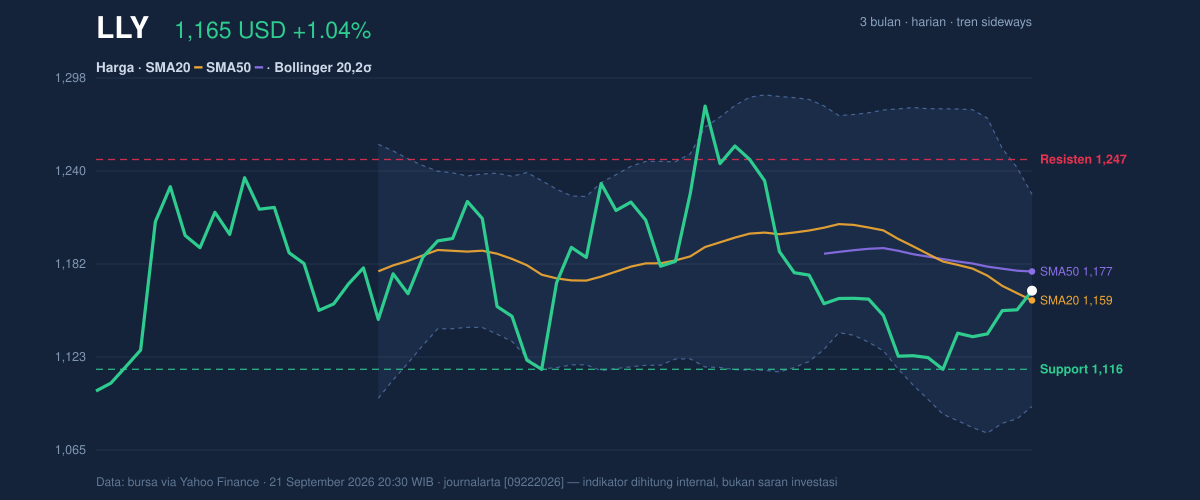
The US$1,115.70 support level is the first area where buyers have previously shown up, while US$1,246.93 resistance marks the next test for any attempt to extend the rebound. Between those two levels, the stock is essentially in a holding pattern. The 3-month range reinforces that message: the shares are still well below the 3-month high of US$1,292.65 and above the 3-month low of US$1,079.22, so the market is trading in the middle of its recent corridor rather than near either extreme.
Oscillators & Momentum
The momentum picture is more constructive than the trend picture. The RSI at 51.3 is neutral, which means the stock is neither overbought nor oversold and has room to move in either direction without immediate technical strain. That neutrality is useful because it leaves the door open for a trend change if price action improves, but it also means there is no strong momentum edge yet.
The Stochastic reading of %K 68.8 and %D 57.9 leans firmer, showing price is pressing toward the upper part of its recent short-term range. Stochastic is often used to gauge whether a move is getting stretched; here it suggests the rebound has some follow-through, but not enough to look exhausted.
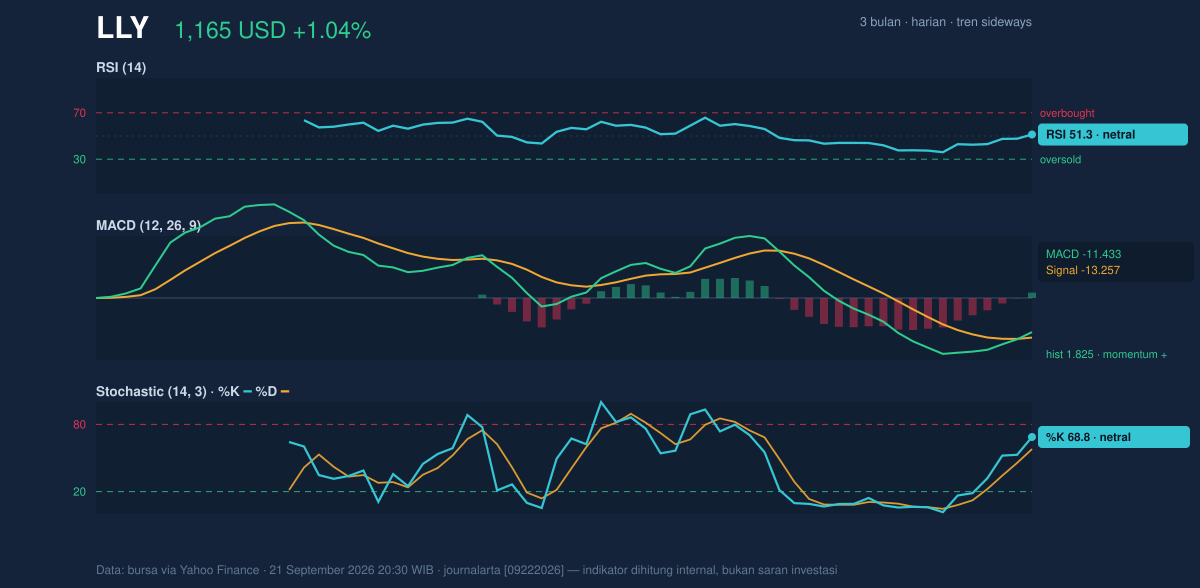
The most telling signal is the MACD at -11.433 versus its signal line at -13.257, with a positive histogram of 1.825. For non-specialists, that means the faster-moving price trend is improving relative to the slower trend, even though both are still below zero. In other words, the stock is gaining upward momentum inside a broader structure that has not fully turned bullish. That is a classic “repair phase” signal: better than weak, but not yet decisive.
Volatility & Volume
Volatility is not flashing alarm bells. The ATR of 26.14, equal to 2.2% of price, points to moderate volatility, which usually means daily moves are large enough to matter but not wild enough to imply panic. The Bollinger Band width of 11.4% is normal, so the stock is not in a squeeze that would usually precede a sharp breakout, nor in an expansion phase that would signal a strong directional move already underway.
The price’s %B reading of 55% shows it is slightly above the band midpoint, another sign of mild upward pressure rather than a stretched rally. Volume adds a subtle confirmation: trading of 2,476,600 shares against a 20-day average of 2,373,105 tells us the move was supported by participation, and the OBV is rising, which means cumulative volume flow is tilting in favor of buyers. That combination matters because price gains are more credible when volume is not fading behind them.
Key Levels & Scenarios
The immediate technical map is straightforward. A sustained move above US$1,176.89 would help the stock reclaim the 50-day average and improve the case that the rebound is becoming more than a short-lived bounce. If that happens, the next visible ceiling is US$1,225.11, the upper Bollinger band, followed by US$1,246.93 resistance. A move into that zone would signal the market is testing the upper end of its current range.
On the downside, US$1,158.79 is the immediate pivot because it is both the 20-day average and the Bollinger midline. Holding above it keeps the short-term structure intact. A failure there would shift attention to US$1,115.70, and a break below that level would weaken the recovery and reopen the path toward the US$1,092.46 lower Bollinger band and the US$1,079.22 3-month low.
Technical Verdict: HOLD (wait & see)
HOLD (wait & see)
- The price is above the 20-day average but still below the 50-day average, so the stock has improved without confirming a full trend reversal.
- The MACD histogram is positive and OBV is rising, which supports the rebound, but RSI is neutral and the broader trend remains sideways.
- Bollinger bands are normal-width and ATR is moderate, so there is no technical urgency for a breakout call.
- Verdict invalidated if price falls below US$1,115.70.
- Ideal entry range: US$1,158.79 to US$1,176.89
- Exit target: US$1,225.11 to US$1,246.93
- Stop loss protection: below US$1,115.70
For non-traders, that means the chart is improving, but Lilly still needs to prove it can hold above support and clear the next ceiling before the move looks durable.
Summary Data LLY
| Last price | 1,164.89 USD |
| Change 1 day / 5 days / 1 month | 1.04% / 2.34% / -7.21% |
| Trend / MA-cross | sideways / none |
| SMA20 / SMA50 | 1,158.79 / 1,176.89 |
| RSI (14) / Stochastic %K | 51.3 / 68.8 |
| Bollinger %B / ATR | 55% / 26.14 |
| Support / Resistance 20 days | 1,115.70 / 1,246.93 |
| Data as of | 21 September 2026 20:30 WIB |


