MRK Momentum Weakens: Stock Gains 1.79% (September 22, 2026)
On September 22, 2026: price 149.50 USD, trend sideways, RSI 60.2, support 143.79, resistance 156.45. technical analysis of mrk stock. MRK Momentum Weakens —…

Merck is trying to hold its recent rebound, but the chart still shows a market that is improving without fully escaping its sideways range. At 149.50 USD, the stock is trading above its short- and medium-term averages, yet momentum has not fully confirmed the move, which matters for a large defensive name like Merck because it suggests buyers are present but not yet dominant.
Trend & Price Action
Merck’s price sits above SMA20 at 148.59 and well above SMA50 at 138.39, which is a constructive setup for the medium term. The important nuance is that the broader trend is still labeled sideways, with the SMA20 slope only 0.25% over 5 days. In plain terms, the stock is drifting upward, but not with enough force to call it a decisive trend. That distinction matters: a sideways market can still look healthy on the surface while remaining vulnerable to reversals if buyers lose conviction.
The latest move also needs context. Merck is up 1.79% on the day and 3.21% over 5 days, but still down 2.00% over 1 month. So the recent bounce has repaired some short-term weakness, yet it has not erased the broader hesitation. As shown in the chart, price is positioned around the middle of the Bollinger band structure, not near the top where strong breakouts usually begin to prove themselves.
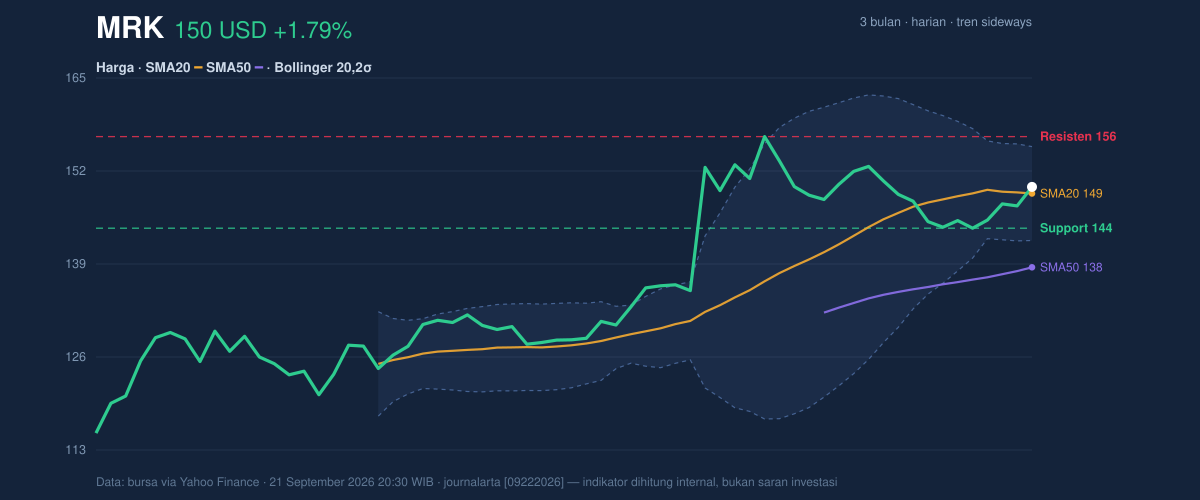
The key message is simple: Merck has reclaimed the short-term average, but it has not broken out of the range that has contained it for months.
Oscillators & Momentum
On the momentum side, the signals are mixed rather than aligned. RSI at 60.2 is neutral-to-firm, which means the stock is not overbought and still has room to extend higher if demand improves. Stochastic %K at 68.5 and %D at 52.7 also point to a market that is leaning upward without being stretched. In practical terms, these oscillators say the recent recovery is real, but not yet overheated.
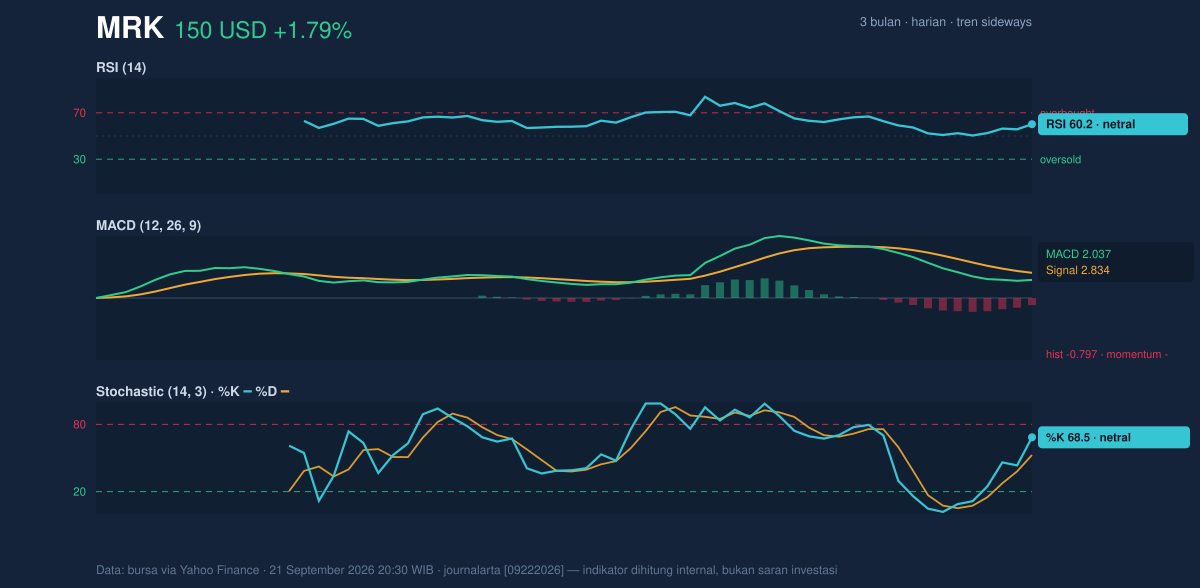
The caution comes from MACD. MACD at 2.037 remains below the signal line at 2.834, with a histogram of -0.797. That negative histogram means short-term momentum is still lagging the longer trend. For readers unfamiliar with the term, MACD is a trend-following indicator: when it sits below its signal line, it often suggests the rally has not yet gained full internal strength. That is why the chart looks better than the momentum panel.
This is the core tension in Merck right now: price is stabilizing, but the momentum engine is still catching up.
Volatility & Volume
Volatility is moderate, not explosive. ATR at 3.01 equals about 2.0% of price, which suggests the stock can move, but not in the kind of abrupt swings seen in highly speculative names. The Bollinger band width is 8.7%, described as normal, so there is no strong squeeze signaling an imminent volatility burst. %B at 57% places price slightly above the band midpoint, consistent with a recovering but not overextended market.
Volume, however, adds a layer of caution. The latest volume of 7,992,700 is only 0.8× the 20-day average of 10,210,235, and OBV is down. OBV, or on-balance volume, tracks whether volume is supporting price moves; a falling OBV means the latest advance is not yet backed by broad accumulation. That matters because rallies on lighter-than-normal participation can fade quickly once they meet resistance.
The move is improving, but the crowd is not fully committing.
Key Levels & Scenarios
The nearest support sits at 143.79, while the nearest resistance is 156.45. Price is currently at about 45% of the range between those levels, which places it closer to the lower half than to an upside breakout zone. That positioning is important: Merck has room to rise before testing resistance, but it is not yet pressing against it.
The broader three-month range adds context. The stock’s 3-month high is 156.92 and the 3-month low is 113.00, so the current price is sitting much nearer the upper end of that range than the lower end. That tells us the recovery from the prior trough is substantial, but also that the chart may need a fresh catalyst to clear the ceiling.
If 156.45 gives way, the chart would begin to look more constructive because the stock would be moving beyond the recent cap. If instead price slips back below 143.79, the short-term rebound would lose credibility and the sideways structure would reassert itself.
Technical Verdict: HOLD (wait & see)
HOLD (wait & see) fits the data because Merck is above SMA20 and SMA50, but MACD remains below its signal line and OBV is falling, which means price strength is not yet fully confirmed by momentum or volume. RSI at 60.2 and Stochastic at 68.5/52.7 are supportive, but not strong enough to override the mixed confirmation picture. The verdict is invalidated if price breaks below 143.79, because that would weaken the current support structure.
- Ideal entry range: 143.79 to 148.59
- Exit target: 156.45 to 156.92
- Stop loss protection: below 143.79
For non-traders, this means Merck looks steadier than it did a month ago, but the chart still wants proof before calling the rebound complete.
The next test is whether the stock can reclaim 156.45 after the latest close at 149.50.
Summary Data MRK
| Last price | 149.50 USD |
| Change 1 day / 5 days / 1 month | 1.79% / 3.21% / -2.00% |
| Trend / MA-cross | sideways / none |
| SMA20 / SMA50 | 148.59 / 138.39 |
| RSI (14) / Stochastic %K | 60.2 / 68.5 |
| Bollinger %B / ATR | 57% / 3.01 |
| Support / Resistance 20 days | 143.79 / 156.45 |
| Data as of | 21 September 2026 20:30 WIB |


