AstraZeneca Stock Gains 1.38%, Testing Key Resistance In Focus
On September 23, 2026: price 12,672.00 GBp, trend sideways, RSI 60.6, support 11,650.00, resistance 12,560.00. technical analysis of astrazeneca stock.

AstraZeneca’s London shares were trading at 12,672.00 GBp at 14:00 WIB on 21 September 2026, up 1.38% on the day and extending gains of 4.26% over five days, according to Yahoo Finance data via the exchange. The move matters because the stock is now pushing beyond its short-term ceiling, but not yet in a clean breakout zone. As shown in the chart, price is sitting above both its short-term averages and the upper Bollinger band, which signals momentum is strong, but also that the shares are stretched relative to recent trading.
Trend & Price Action
The broader pattern is still sideways, even though the latest leg higher has improved the tone. The SMA20 at 12,096.10 is below the current price, while the SMA50 at 12,188.00 also sits underneath, so the stock is trading above both trend markers. That is constructive, because it shows buyers have been willing to pay up in the near term and have absorbed supply around the moving averages. But the absence of a fresh MA-cross means the chart has not yet delivered a stronger trend-confirmation signal; this is more an advance inside a range than a decisive regime change.
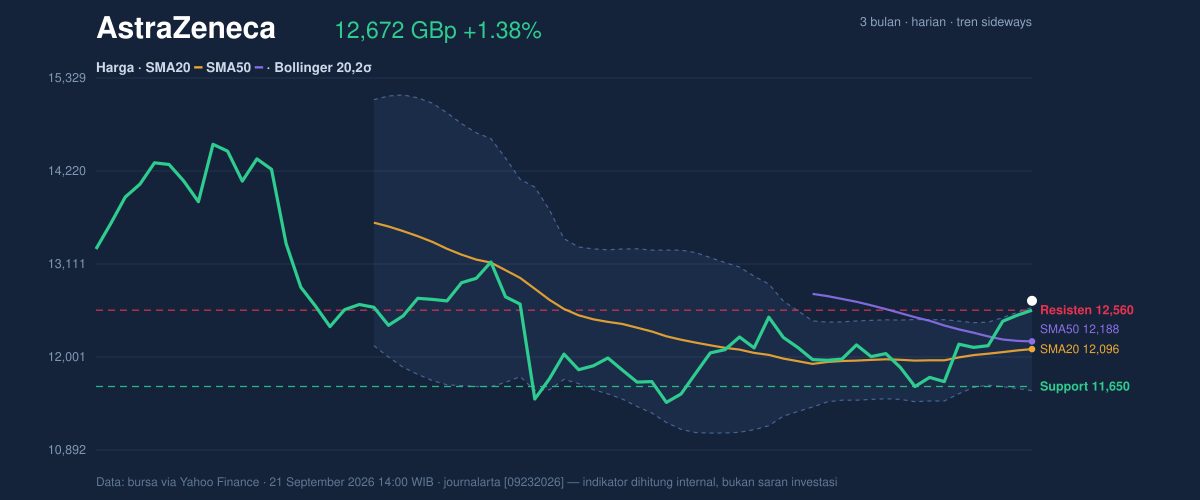
The price is also positioned near the upper end of its recent structure. The 20-hour resistance at 12,560.00 has already been exceeded, and the stock is now trading at 112% of the range, which tells readers the move has run ahead of the immediate band that has contained trading. That often reflects urgency from buyers, but it can also mean the market is vulnerable to a pause if fresh demand does not keep arriving. Against the broader backdrop, the 3-month range remains wide, from 9,892.00 to 14,686.00, leaving room for more movement without yet implying a trend reversal.
Oscillators & Momentum
Momentum is mixed, and that is the key nuance in the chart. The RSI at 60.6 is still neutral, which means the stock is not in an extreme condition on that measure. In plain language, RSI is saying the move has strength, but not enough to call it overheated on its own. That is different from the stochastic oscillator, where %K at 93.4 and %D at 94.8 are both firmly overbought. This usually means the latest push has been fast enough to leave the stock vulnerable to a short-term pullback or consolidation, even if the wider trend remains intact.
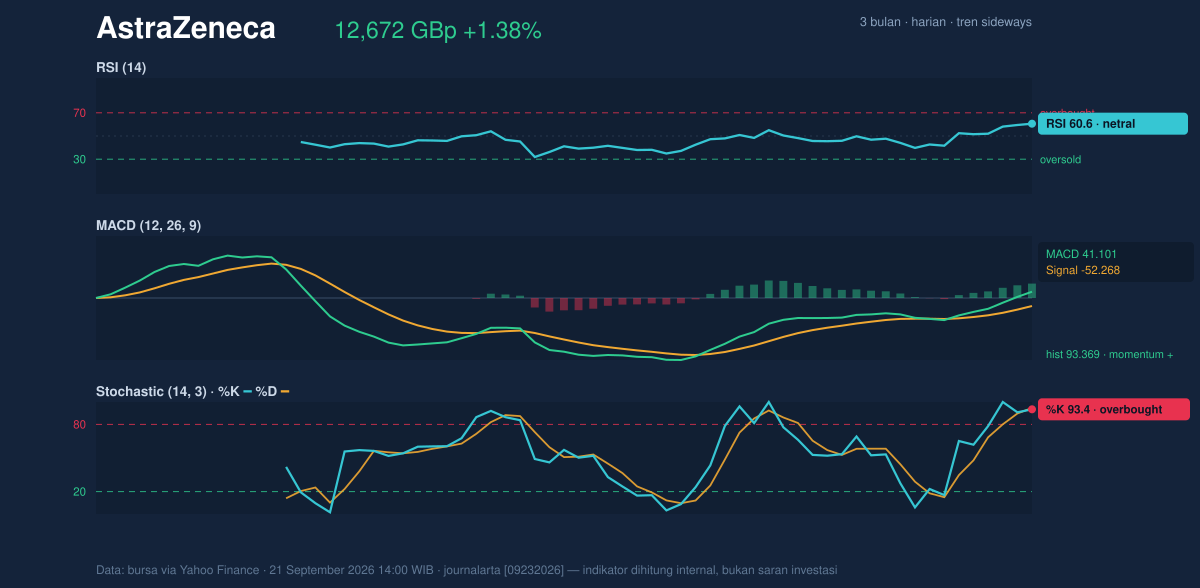
The MACD picture is more supportive. With MACD at 41.101, the signal line at -52.268, and a histogram of 93.369, the indicator is showing positive momentum with a wide gap between the MACD line and its signal line. For general readers, that gap suggests the recent price impulse is still expanding rather than fading. In other words, the stock has not just drifted higher; it has done so with enough force to keep trend-following signals positive. The tension is that the stochastic is warning of exhaustion while MACD says the move still has fuel. That combination often produces choppy sessions rather than a straight line.
Volatility & Volume
Volatility is not flashing alarm bells, but it is active enough to matter. The ATR at 295.61, equal to 2.3% of price, points to moderate daily movement. That means AstraZeneca can still swing meaningfully without breaking the larger pattern, and traders watching the chart should expect ordinary noise around the range edges. The Bollinger setup is more revealing: the upper band is 12,592.47, the middle band is 12,096.10, and the lower band is 11,599.73. With %B at 108%, price is trading above the upper band, which usually indicates an extension beyond the recent statistical range. That is a sign of strength, but also a warning that the shares are no longer cheaply positioned versus the recent average.
The band width of 8.2% is normal, so this is not a volatility squeeze waiting to explode. Instead, the market is already moving, and the question is whether it can hold above the upper band or revert toward the middle band. Volume helps the bullish case somewhat. Turnover of 3,916,913 was about 1.2× the 20-hour average, and OBV is rising, which indicates participation has improved rather than the price rising on thin trade. That matters because a breakout attempt with rising volume is more credible than one built on a quiet session.
Key Levels & Scenarios
The most immediate support sits at 11,650.00, while the nearest resistance reference is 12,560.00. Since price is already above that resistance, the market is now testing whether the breakout can hold. If the shares stay above the upper Bollinger band and maintain volume above average, the chart would continue to favor buyers. If they slip back below 12,560.00 and then lose the 12,096.10 area, the move would look more like a failed extension and a return toward the middle of the range.
The broader context still matters. The 3-month high at 14,686.00 shows the stock has traded materially higher before, so the current level is not an extreme in historical terms. But the immediate setup is more important than the distant high. Right now the market is asking whether momentum can convert a range breakout into a sustained trend, or whether overbought oscillators will force a reset first.
Technical Verdict: HOLD (wait & see)
HOLD (wait & see)
- MACD is positive and the histogram remains strongly supportive, which keeps trend momentum constructive.
- Price is above SMA20 and SMA50, so the short-term structure is still firm.
- Stochastic is overbought and %B is above 100%, which raises the chance of near-term cooling after a sharp run.
Verdict invalidated if price falls below 11,650.00.
- Ideal Entry Range: 12,096.10 to 12,560.00
- Exit Target: 12,672.00, then the next extension if the breakout holds
- Stop Loss protection: 11,650.00
For non-traders, this means the share price is strong, but it is also stretched enough that patience is more sensible than chasing the move.
Summary Data AstraZeneca
| Last price | 12,672.00 GBp |
| Change 1 day / 5 days / 1 month | 1.38% / 4.26% / 3.53% |
| Trend / MA-cross | sideways / none |
| SMA20 / SMA50 | 12,096.10 / 12,188.00 |
| RSI (14) / Stochastic %K | 60.6 / 93.4 |
| Bollinger %B / ATR | 108% / 295.61 |
| Support / Resistance 20 days | 11,650.00 / 12,560.00 |
| Data as of | 21 September 2026 14:00 WIB |


