Momentum Weakens, Shell Stock Drops 0.82% Today
On September 23, 2026: price 3,510.00 GBp, trend uptrend, RSI 53.3, support 3,311.00, resistance 3,652.50. technical analysis of shell stock.

Shell plc edged down on the London Stock Exchange to 3,510.00 GBp after a weak session that left the shares below the previous close of 3,539.00, even as the broader technical structure still points to an uptrend. The move matters because it shows a stock that is still trading above its short- and medium-term averages, but is no longer advancing with the same force: price is holding above trend support, while momentum gauges are beginning to cool.
Trend & Price Action
The chart shows Shell sitting above SMA20 at 3,476.73 and well above SMA50 at 3,368.82, which is the clearest sign that the medium-term trend remains intact. That positioning usually tells traders the market is still willing to pay up for the stock on dips, even if it is not rushing higher. The absence of a fresh MA-cross means there is no new moving-average signal to reset the trend story; instead, the existing configuration is doing the work.
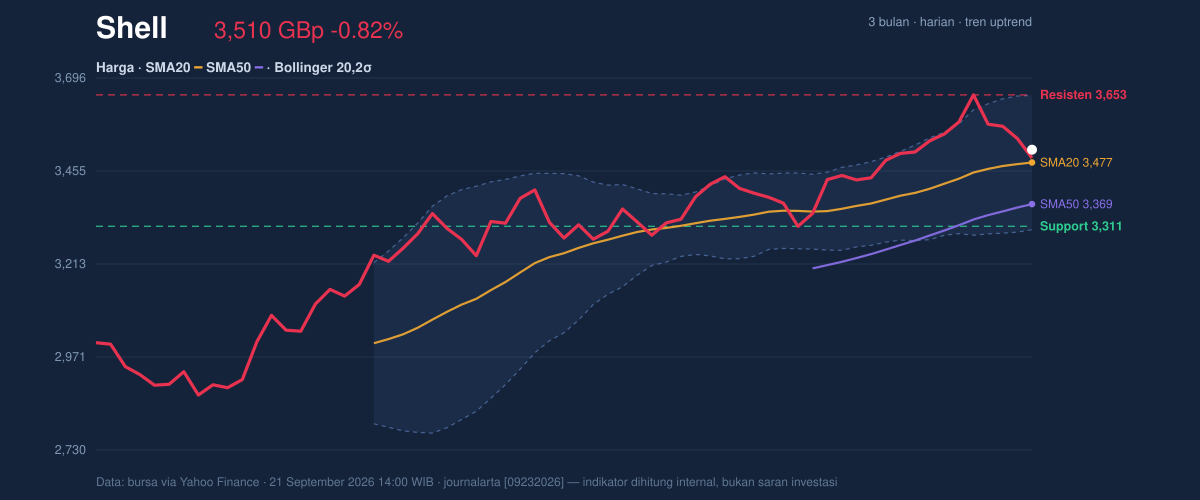
The more important detail is where the share price sits inside the recent range. At 3,510.00 GBp, Shell is trading in the upper half of the 20-hour band and around 58% of the way through the 3,311.00 to 3,652.50 support-resistance range. That is constructive, but not decisive. It says the stock is not under distribution pressure, yet it is also not pressing the ceiling with conviction. The 3-month high of 3,663.50 sits just above the current resistance area, so the market is close enough to a prior peak that any failure here would be noticed quickly.
Oscillators & Momentum
Momentum is more mixed than the trend. RSI at 53.3 is neutral, which means the stock is neither stretched nor washed out; it is simply in a middle zone where direction still needs confirmation from price. The Stochastic %K at 36.7 versus %D at 55.1 is softer, and that gap suggests near-term momentum has slipped below its own signal line. In plain language, the stock is not oversold, but it has lost some short-term speed.
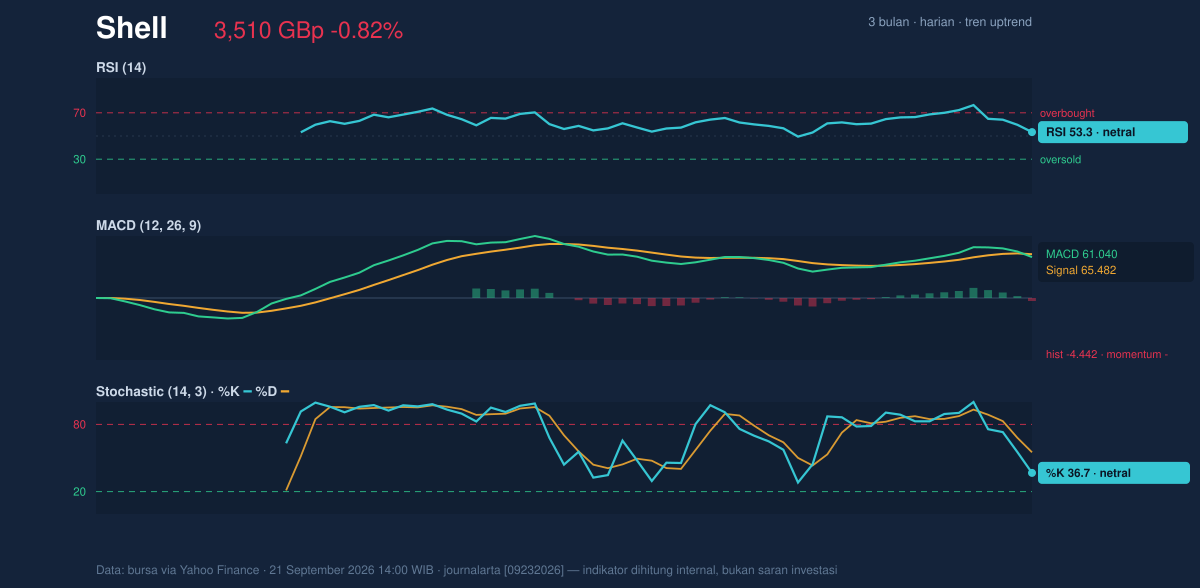
The most cautionary signal is the MACD histogram at -4.442, with MACD at 61.040 below the signal line at 65.482. That combination usually means the trend is still up, but the push behind it is fading. For readers unfamiliar with the indicator, MACD measures whether recent price gains are accelerating or slowing; a negative histogram says the latter. In a stock like Shell, that often shows up before a pause, a sideways consolidation, or a brief pullback rather than an outright trend reversal.
Volatility & Volume
Volatility is contained rather than explosive. The Bollinger Bands are in a normal 10.0% width configuration, and %B at 60% places Shell slightly above the middle of the band structure, not near the upper edge. That matters because it suggests the stock has room to move either way without immediately hitting an overbought extreme. The middle band at 3,476.73 also aligns with SMA20, reinforcing that this is the key pivot for the current phase.
The ATR(14) at 62.91, or 1.8% of price, points to moderate daily movement. That is enough to generate meaningful swings, but not enough to imply panic. Volume, however, is the weak spot in the setup. Last traded volume was 5,373,072, only 0.5x the 20-hour average of 10,947,093. Thin participation often means the latest move has not yet won broad confirmation from the market. The encouraging counterpoint is that OBV is rising, which suggests cumulative buying interest has not disappeared even though the latest session was quiet.
Key Levels & Scenarios
The immediate floor is the 3,476.73 area, where SMA20 and the Bollinger middle band converge. If Shell holds above that zone, the uptrend remains technically healthy and the market can continue to digest the recent slip without damaging the structure. If that level fails, the next important support is 3,311.00, which is the lower end of the 20-hour range and the first area where buyers have recently stepped in.
On the upside, 3,652.50 is the near-term resistance to watch, with the 3,651.20 upper Bollinger Band sitting almost on top of it. That tight clustering is useful: it shows the stock is approaching a zone where both price history and volatility boundaries may cap advances. A clean move through that area would open the path toward the 3,663.50 three-month high, but the current volume profile says that kind of break would need stronger participation than the latest session delivered.
Technical Verdict: HOLD (wait & see)
HOLD (wait & see)
- Trend support is intact: price is above SMA20 at 3,476.73 and SMA50 at 3,368.82, which keeps the broader structure constructive.
- Momentum is weakening: MACD histogram -4.442 and Stochastic %K below %D show the advance is losing pace.
- Participation is light: volume is only 0.5x the 20-hour average, so the latest move lacks strong confirmation.
- Verdict invalidated if price breaks below 3,311.00, because that would place Shell through the lower end of the recent range and weaken the current trend setup.
- Ideal Entry Range: 3,476.73 to 3,311.00
- Exit Target: 3,652.50 to 3,663.50
- Stop Loss protection: below 3,311.00
For non-traders, this means Shell still looks technically supported, but the recent move is not strong enough yet to call it a clean breakout.
Summary Data Shell
| Last price | 3,510.00 GBp |
| Change 1 day / 5 days / 1 month | -0.82% / -2.01% / 2.95% |
| Trend / MA-cross | uptrend / none |
| SMA20 / SMA50 | 3,476.73 / 3,368.82 |
| RSI (14) / Stochastic %K | 53.3 / 36.7 |
| Bollinger %B / ATR | 60% / 62.91 |
| Support / Resistance 20 days | 3,311.00 / 3,652.50 |
| Data as of | 21 September 2026 14:00 WIB |


