HSBC Stock Drops 0.21%, Testing Support Level In Focus
On September 23, 2026: price 1,509.40 GBp, trend sideways, RSI 50.4, support 1,503.80, resistance 1,580.20. technical analysis of hsbc stock.

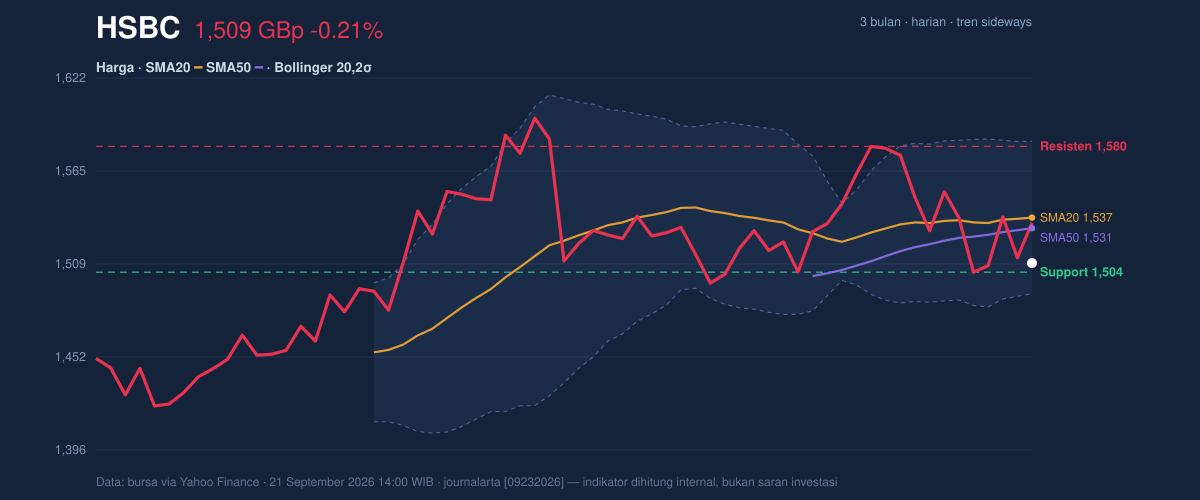
At 1,509.40 GBp, HSBC Holdings is trading just above its 20-day lower Bollinger band and below both short-term moving averages, a setup that keeps the shares in a sideways pattern but with a slight downward bias. The move is modest on the day at -0.21%, yet the more important signal is that price remains below the SMA20 at 1,536.99 and below the SMA50 at 1,530.56, which means recent trading has not been strong enough to reclaim the short-term trend line. As shown in the chart, this is less a decisive breakdown than a market waiting for a catalyst, with the current price sitting near the lower half of the recent range and only a thin cushion above support.
Trend & Price Action
The chart shows HSBC drifting inside a compressed band rather than trending cleanly in either direction. The SMA20 at 1,536.99 is edging up only slightly, with the stated slope at 0.10% over 5 days, which signals a market that is not accelerating lower, but also not building enough upward momentum to retake control. The fact that price is below the SMA20 matters because it tells readers that the latest closes are still being accepted beneath the short-term average, a common sign that buyers have not yet forced a trend reversal. There is no new MA-cross, so the moving averages are not giving a fresh directional signal; instead, they are reinforcing the idea of consolidation.
The stock is also trading at about 7% of the way up from support at 1,503.80 toward resistance at 1,580.20, which places it much closer to the floor than the ceiling. That positioning often means the market is testing whether support can absorb supply before any attempt higher.
The price structure is compressed, not broken.
Oscillators & Momentum
Momentum indicators are mixed, but the balance is still cautious. The RSI at 50.4 sits almost exactly at the midpoint, which usually means the market is neither overbought nor oversold; in plain English, there is no strong momentum edge either way. The Stochastic %K at 39.3 and %D at 32.4 are also neutral, but they sit below the midpoint, suggesting the short-term rebound impulse is still incomplete. That is important because a neutral oscillator reading in a price series trading below moving averages is not the same as strength; it often means the market is pausing before choosing direction.
The more decisive signal comes from MACD. The MACD at -0.170 remains below the signal line at 3.553, and the histogram at -3.723 shows negative momentum is still dominant. MACD is a trend-following gauge, so when it stays below its signal line, it implies the recent price path is weaker than the longer baseline. In this case, the indicator is not collapsing, but it is not confirming a recovery either.
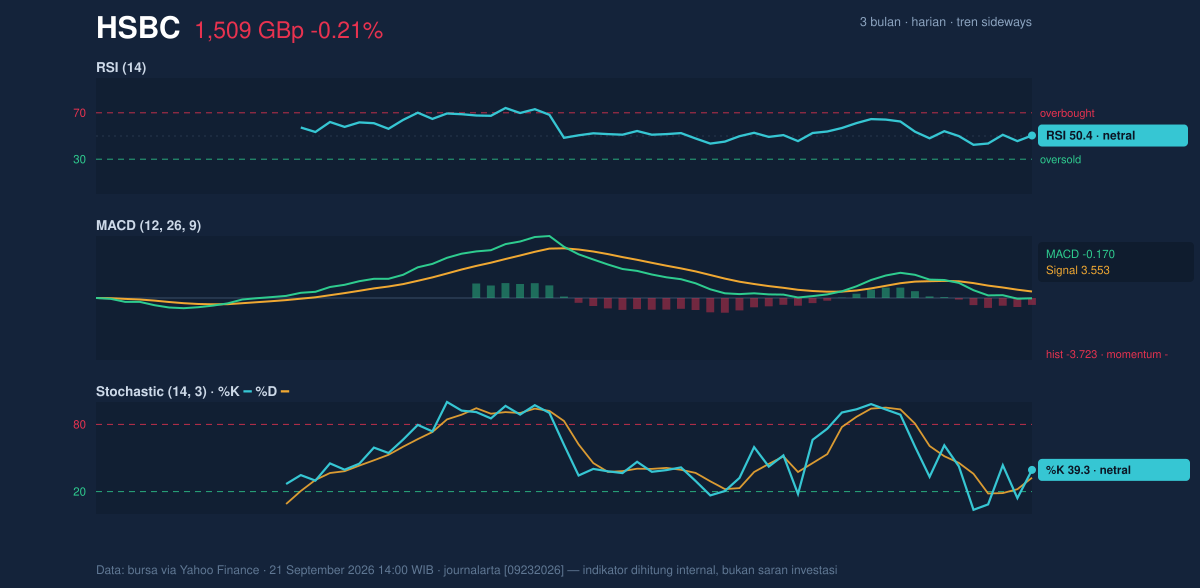
RSI is neutral, Stochastic is neutral, but MACD is still negative.
Volatility & Volume
Bollinger Bands add an important layer to the story. Price is sitting near the lower band at 1,490.71, while the middle band is 1,536.99 and the upper band is 1,583.27. The current %B of 20% means HSBC is trading near the lower fifth of the band structure, which usually reflects weak upside pressure or a market that is still leaning toward the downside. At the same time, the 6.0% band width indicates the bands are tightening, a classic squeeze condition. A squeeze does not predict direction by itself, but it often means price is storing energy for a larger move once the range breaks.
Volume does not yet validate a breakout scenario. Last volume was 10,789,145, well below the 20-day average of 19,633,429, or about 0.5x normal activity. That matters because low participation weakens the credibility of any move: if price drifts higher without volume, it can fade; if it slips lower on thin tape, it can still be vulnerable to a sharper move once activity returns. The OBV is falling, which means cumulative volume flow is still leaning away from the shares rather than supporting them.
Volatility is compressed, but participation is not confirming strength.
Key Levels & Scenarios
The immediate line in the sand is support at 1,503.80. That level is especially important because it sits only slightly below the last price and near the lower Bollinger band at 1,490.71, so a clean break would raise the risk of a deeper test toward the lower part of the recent range. On the upside, resistance at 1,580.20 overlaps with the upper part of the current trading corridor and sits below the 3-month high of 1,610.00, making it the first meaningful barrier to any recovery.
If HSBC can reclaim the 1,536.99 area, that would improve the short-term tone because it would put price back above the Bollinger midline and the SMA20. If it fails to hold 1,503.80, the chart would shift from neutral consolidation to a more fragile setup, especially given the negative MACD and falling OBV. The 3-month low of 1,350.00 remains the broader downside reference, but the market is not yet close enough to that zone to make it the immediate focus.
Technical Verdict: HOLD (wait & see)
HOLD (wait & see) is the clearest reading from the current chart because price is boxed between support and resistance, momentum is mixed, and volume is too light to confirm a directional move.
- MACD remains negative, showing bearish momentum is still active even though the stock is not in a full breakdown.
- Price is below SMA20 and SMA50, which keeps the short-term trend from turning constructive.
- Bollinger Bands are squeezing, which signals a larger move may be coming, but direction is not confirmed.
Verdict invalidated if price breaks below 1,503.80 and fails to recover.
- Ideal Entry Range: 1,490.71 to 1,503.80
- Exit Target: 1,536.99 to 1,580.20
- Stop Loss Protection: below 1,490.71
In plain English: HSBC is not clearly trending, so the chart is asking for patience until either support gives way or resistance is reclaimed.
The next reference level on the tape is 1,503.80.
Summary Data HSBC
| Last price | 1,509.40 GBp |
| Change 1 day / 5 days / 1 month | -0.21% / -1.78% / -0.59% |
| Trend / MA-cross | sideways / none |
| SMA20 / SMA50 | 1,536.99 / 1,530.56 |
| RSI (14) / Stochastic %K | 50.4 / 39.3 |
| Bollinger %B / ATR | 20% / 31.01 |
| Support / Resistance 20 days | 1,503.80 / 1,580.20 |
| Data as of | 21 September 2026 14:00 WIB |


