BP Momentum Weakens: Stock Drops 2.94% (September 23, 2026)
On September 23, 2026: price 542.30 GBp, trend sideways, RSI 47.7, support 514.50, resistance 580.30. technical analysis of bp stock. BP Momentum Weakens —…

BP plc is drifting in the middle of its recent range, with the shares easing to 542.30 GBp in London trading after closing at 558.70 GBp, a move that leaves the stock neither broken nor convincingly recovering. The message from the chart is simple. The market is waiting.
BP’s latest tape suggests a stock that is still digesting its recent decline rather than starting a fresh trend. The shares are down 2.94% on the day, off 5.06% over five days and 1.31% over one month, which tells investors that selling pressure has been persistent but not yet decisive enough to force a full breakdown. That fits the broader read of sideways trading: the stock is moving, but not in a clean direction.
Trend & Price Action
As shown in the chart, BP is trading below its SMA20 at 547.26 but above its SMA50 at 537.10. That positioning matters because it places the stock in a narrow zone between short-term weakness and medium-term support. In plain terms, the recent pullback has been enough to slip under the near-term average, but not enough to damage the longer of the two trend markers.
The lack of a new MA-cross also matters. A moving-average cross is often used by traders to identify when a short-term trend has overtaken a longer one. Here, no fresh cross means the market has not yet committed to a stronger bullish or bearish phase. The SMA20 slope of 1.10% over five days still points upward, but only modestly, which is consistent with a range-bound stock rather than a breakout candidate.
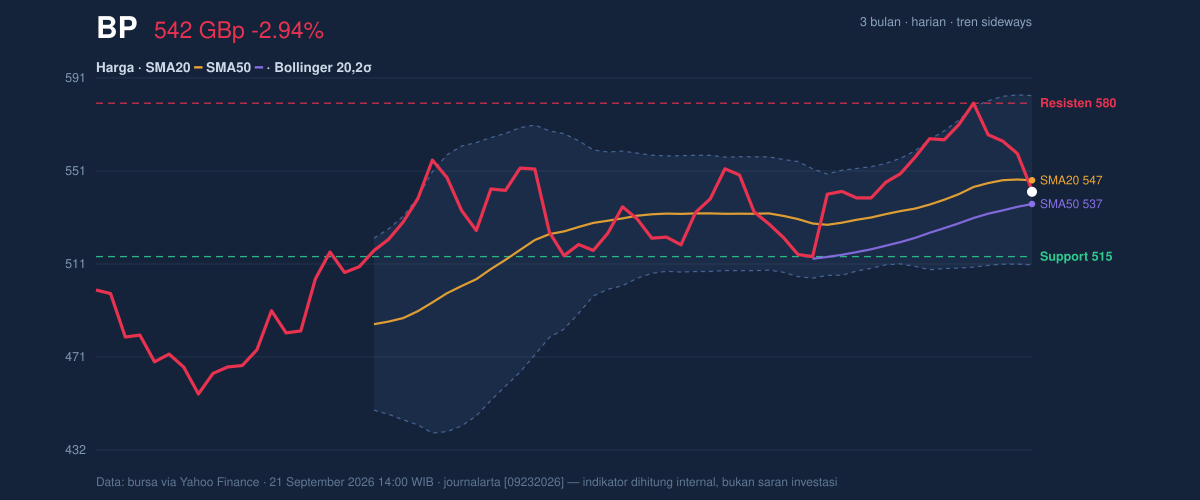
BP is also sitting at roughly 42% of its 20-day range, with 20-day support at 514.50 and 20-day resistance at 580.30. That midpoint location is important: it says the stock is not near an obvious exhaustion low, but it is also not close enough to resistance to suggest strong upside momentum. The recent 3-month high of 582.60 sits just above the current resistance zone, reinforcing the idea that the market has already tested the upper end of this band and backed away.
Oscillators & Momentum
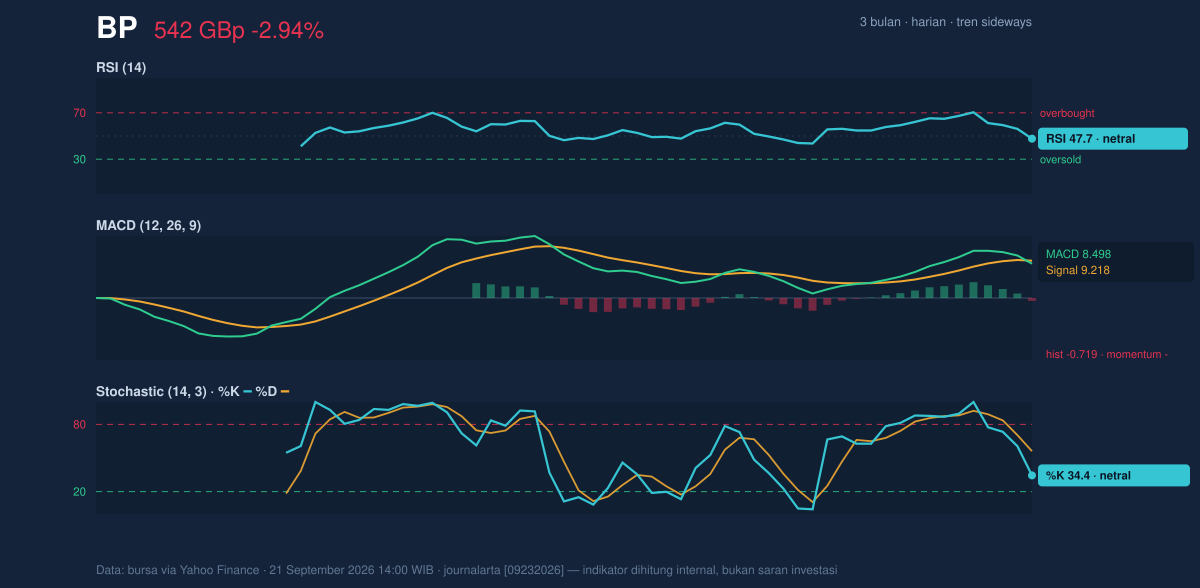
The momentum picture is mixed, but the balance is slightly cautious. BP’s RSI(14) at 47.7 is neutral, which means the stock is neither overbought nor oversold. That is often a sign of indecision: buyers and sellers are roughly balanced, but neither side has enough force to set a trend. The Stochastic %K at 34.4 and %D at 56.1 also remains neutral, though the gap between the two lines hints that short-term momentum has softened.
The key warning comes from the MACD at 8.498, which sits below the signal line at 9.218, leaving a histogram of -0.719. In technical terms, that means momentum has turned negative even if the broader trend has not fully rolled over. This is the kind of signal that often appears when a stock is losing upward drive before price actually breaks support. It does not guarantee a deeper fall, but it does say rallies may struggle unless momentum improves.
Volatility & Volume
Volatility is present, but not extreme. BP’s ATR(14) of 15.97, equal to 2.9% of price, indicates moderate daily movement. That matters because moderate volatility can allow a stock to grind within a band for longer, rather than snap sharply in one direction. The Bollinger Bands help confirm that: the price is below the middle band at 547.26, but the band width of 13.3% is described as normal, not compressed. In other words, this is not a classic squeeze that often precedes a sharp expansion; the market has room to move, but no strong setup is flashing yet.
The %B reading of 43% places the stock below the midpoint of the Bollinger envelope, which is consistent with a mild bearish tilt. Still, it is not near the lower band at 510.94, so the chart is not yet signaling capitulation.
Volume adds an important nuance. Last trade volume of 41,854,286 was only 0.9x normal against the 20-hour average of 46,548,558, so the latest decline was not driven by unusually heavy participation. That weakens the bearish case somewhat, because powerful down moves often arrive with stronger turnover. The OBV is rising, which suggests underlying accumulation has not disappeared even as price has softened. In practical terms, that can mean some investors are still adding on dips, limiting the force of the selloff.
Key Levels & Scenarios
The market’s immediate map is clear. 514.50 is the nearest support to watch, while 580.30 is the first meaningful resistance. A move back above the SMA20 at 547.26 would help repair short-term sentiment, because it would put the shares back on the neutral line of the Bollinger structure. Failure to hold the SMA50 at 537.10 would be more serious, since that would place the stock below both key moving averages and increase the risk of a slide toward the lower band at 510.94.
The broader range also matters. The 3-month low of 450.60 is far enough away to show that the stock has already recovered from a deeper selloff, but close enough to remind readers that the current range still sits within a volatile year-to-date-type trading band.
Technical Verdict: HOLD (wait & see)
HOLD (wait & see) fits the chart because BP is trapped between a soft short-term trend and a still-intact medium-term base.
- MACD is negative at 8.498 versus 9.218, showing momentum is currently weaker.
- RSI at 47.7 and Stochastic 34.4/56.1 are neutral, so there is no strong oversold rebound signal yet.
- Price below SMA20 but above SMA50 suggests the stock is in a holding pattern, not a confirmed breakdown.
- Invalidation: this verdict is invalidated if price breaks 514.50, the 20-hour support.
- Ideal entry range: 537.10 to 547.26
- Exit target: 580.30
- Stop loss protection: 514.50
For non-traders, that means BP is not sending a clean directional signal yet, and the next decisive move will likely come only if it can reclaim the short-term averages or lose support at 514.50.
Summary Data BP
| Last price | 542.30 GBp |
| Change 1 day / 5 days / 1 month | -2.94% / -5.06% / -1.31% |
| Trend / MA-cross | sideways / none |
| SMA20 / SMA50 | 547.26 / 537.10 |
| RSI (14) / Stochastic %K | 47.7 / 34.4 |
| Bollinger %B / ATR | 43% / 15.97 |
| Support / Resistance 20 days | 514.50 / 580.30 |
| Data as of | 21 September 2026 14:00 WIB |


