DBS Stock Analysis: Gains 0.57%, Testing Key Resistance
On September 23, 2026: price 77.80 SGD, trend uptrend, RSI 59.1, support 75.65, resistance 78.65. technical analysis of dbs stock. DBS Stock Analysis — full…

DBS Group’s shares were last at 77.80 SGD on SGX, up 0.57% from the previous close of 77.36, with the stock trading near the upper part of its recent band. The message from the chart is straightforward: the price is still in an uptrend, sitting above the SMA20 at 77.23 and well above the SMA50 at 75.65, which tells investors the medium-term structure remains constructive even if the latest momentum has cooled. The stock is now 72% of the way through its 20-day range, close enough to resistance to force a decision, but not yet at a clear breakout point.
Trend & Price Action
As shown in the chart, DBS is trading in a pattern that still favors buyers: the SMA20 is rising at 0.39% over 5 days, and price is holding above both the short- and medium-term averages. That matters because moving averages are not just lines on a chart; they reflect where the market has been willing to do business. When price stays above the SMA20 and SMA50, dips are being absorbed rather than turning into deeper selloffs. The lack of a fresh MA cross also suggests this is less a sudden trend change than an established advance that is pausing near the top of its recent range.
The stock is also trading below the 3-month high of 79.05, which leaves room for the market to test that ceiling again if buyers keep control. But the proximity to resistance means the next move matters more than the last one.
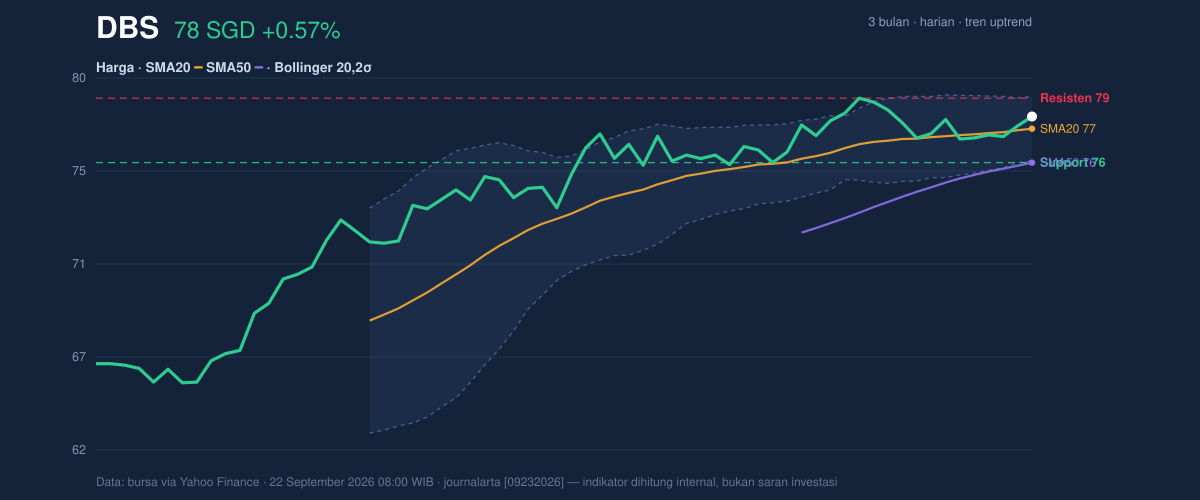
A price sitting in the upper half of the range is a sign of relative strength. It is not a guarantee of continuation.
Oscillators & Momentum
The momentum picture is more mixed than the trend picture. The RSI at 59.1 is neutral, which means the stock is not stretched enough to suggest exhaustion, but it is also not showing a strong fresh burst of upside energy. The Stochastic %K at 54.4 and %D at 37.6 is also neutral, but with %K above %D, it hints that short-term momentum has improved from a softer patch. That is a modestly positive sign, not a decisive one.
The more important caution comes from the MACD at 0.533 versus the signal line at 0.694, with a histogram of -0.161. In plain terms, the trend is still up, but the momentum engine is running below its own average. A negative histogram often means the recent pace of gains is slowing, even if the broader structure has not broken. That is exactly the kind of signal that can precede either a consolidation or a breakout attempt — but not both at once.
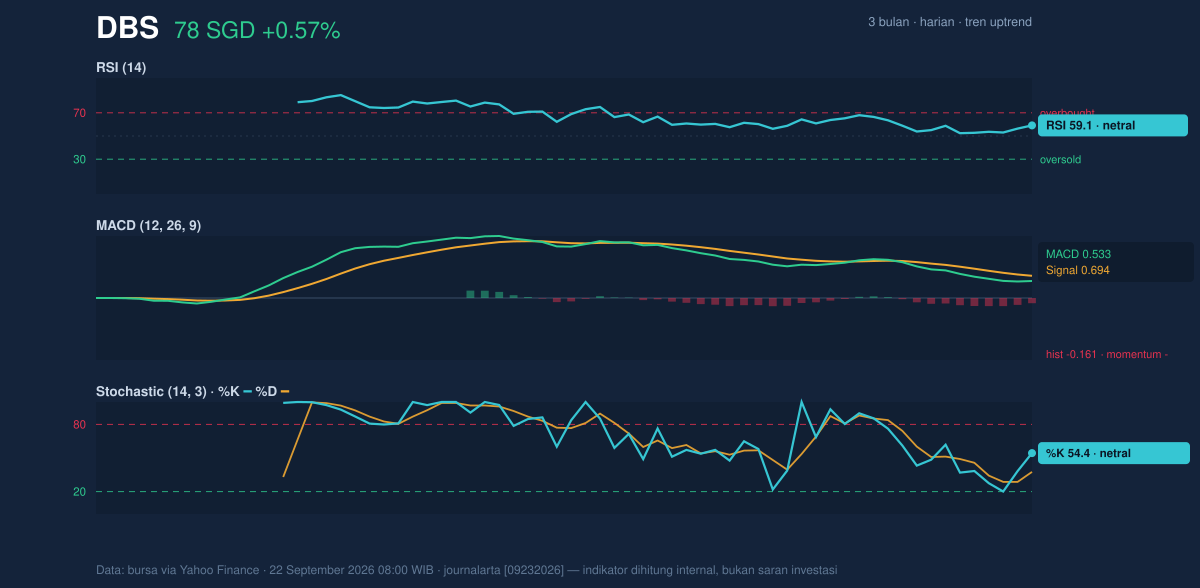
This is not a weak chart. It is a chart waiting for confirmation.
Volatility & Volume
Volatility is subdued. The ATR(14) of 0.86, equal to about 1.1% of price, points to a relatively quiet session environment, where large intraday swings are less likely unless a catalyst appears. At the same time, the Bollinger Band structure is important: price is sitting below the upper band at 78.73, above the middle band at 77.23, and the band width is only 3.9%. That is a classic squeeze setup, meaning the market has compressed and may be storing energy for a larger move. Squeezes do not predict direction on their own; they tell traders that compression has replaced expansion, and compression usually ends.
Volume adds a constructive layer. The latest turnover of 4,406,500 shares is about 1.2x normal versus the 20-day average of 3,545,625, while OBV is rising. That combination matters because rising volume and OBV suggest participation is broadening rather than fading. In practical terms, the market is showing enough trading interest to support the current price zone, even though momentum has not yet fully re-accelerated.
Key Levels & Scenarios
The immediate level to watch on the upside is 78.65 resistance, very close to the 78.73 upper Bollinger band. If DBS can move through that area, the chart would be signaling that the squeeze is resolving upward and that buyers are willing to pay up beyond the recent range. On the downside, 75.65 support lines up with the SMA50, making it the key floor for the current structure. A hold above that zone keeps the broader uptrend intact; a break below it would suggest the market is losing the medium-term trend support that has helped define the move.
The setup is therefore balanced but not neutral. Price is elevated, volume is supportive, and volatility is compressed — a combination that often leads to a sharper move, but the MACD warns that upside momentum still needs to catch up.
DBS is in a constructive uptrend, but the chart is now asking for proof that the squeeze can resolve higher rather than fade back into the moving averages.
Technical Verdict: HOLD (wait & see)
- Reason 1: Price is above the SMA20 and SMA50, so the broader trend remains positive.
- Reason 2: Bollinger Bands are squeezing, which often precedes a larger move, but direction is not confirmed yet.
- Reason 3: MACD histogram is negative, showing momentum is still softer than the trend.
- Verdict invalidated if price falls below 75.65, because that would break the key support and the SMA50 floor.
- Ideal Entry Range: 75.65 to 77.23
- Exit Target: 78.65 to 78.73
- Stop Loss protection: below 75.65
In plain English: the shares still look healthy, but the chart is waiting for either a clean push through resistance or a slip back to the support line.
Summary Data DBS
| Last price | 77.80 SGD |
| Change 1 day / 5 days / 1 month | 0.57% / 1.37% / 1.83% |
| Trend / MA-cross | uptrend / none |
| SMA20 / SMA50 | 77.23 / 75.65 |
| RSI (14) / Stochastic %K | 59.1 / 54.4 |
| Bollinger %B / ATR | 69% / 0.86 |
| Support / Resistance 20 days | 75.65 / 78.65 |
| Data as of | 22 September 2026 08:00 WIB |



