DIS Stock Gains 1.12%, Testing Support Level In Focus
On September 23, 2026: price 103.82 USD, trend sideways, RSI 46.9, support 102.67, resistance 111.25. technical analysis of dis stock. DIS Stock Gains — full…

Disney’s shares ended at 103.82 USD on 21 September 2026, up 1.12% on the day, but the larger message in the chart is less upbeat: the stock is still trading below its 20-day average of 106.82 and only just above the 50-day average of 102.88. That places Walt Disney in a narrow technical corridor where the market is neither rewarding momentum nor fully rejecting the name. As shown in the chart, the stock sits in a sideways pattern, and the recent bounce looks more like a test of support than a confirmed trend change.
Trend & Price Action
The structure is important here. A stock trading below the short-term average but above the longer one often signals a market that has not chosen a direction yet. In Disney’s case, the SMA20 is 106.82 and the SMA50 is 102.88, with no fresh moving-average crossover. That matters because crossovers are often watched for trend confirmation; without one, the chart is saying the prior move has lost conviction rather than reversed cleanly.
The slope of the SMA20 at -0.18% over 5 days reinforces that idea: short-term momentum is still easing, even if the decline is not steep. Price is also sitting near the lower half of the recent band structure, with the 20-hour support at 102.67 and 20-hour resistance at 111.25. That puts the current quote close to the lower boundary of the range, which is usually where traders watch for either a rebound or a breakdown.
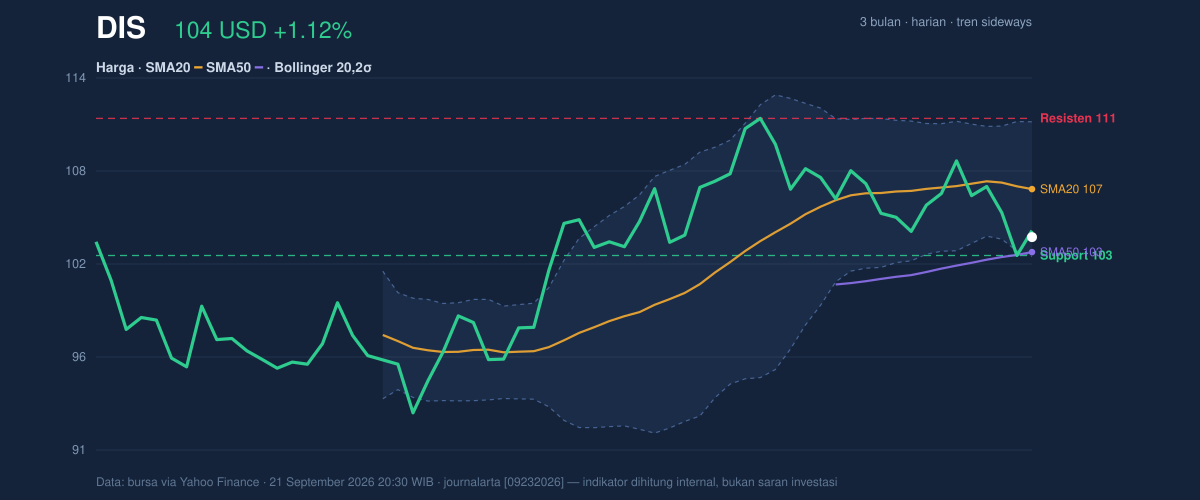
The broader three-month range gives the move more context. Disney’s 3-month high is 111.87 and the 3-month low is 92.49, so the current price is not under extreme pressure, but it is also far from reclaiming the upper end of the band. In plain English: the stock is stuck in the middle of a bigger recovery attempt, and the market has not yet signaled that it wants to extend higher.
Oscillators & Momentum
Momentum indicators are mixed, and that is the clearest reason this chart does not yet look like a strong trend reversal. The RSI at 46.9 is neutral, which means the stock is not oversold enough to imply panic, nor strong enough to suggest sustained upside pressure. The Stochastic %K at 26.4 and %D at 22.4 are also neutral, but they are sitting close to the lower end of the scale. That often tells readers the stock is near a potential turn point, though not one that has been confirmed.
The deeper warning comes from MACD. Disney’s MACD is 0.217 versus a signal line of 0.811, leaving a histogram of -0.594. That negative histogram means the shorter-term trend is still weaker than the slower trend, even though the MACD line itself remains above zero. In practical terms, the stock has not collapsed, but the momentum engine is still running below ideal speed.
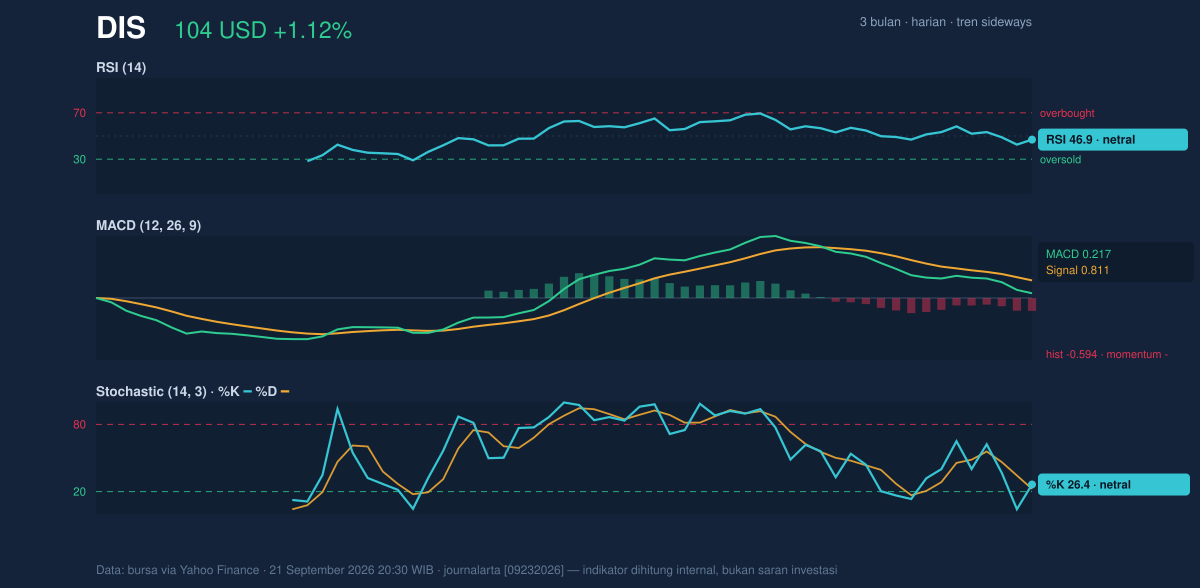
That combination — neutral RSI, low Stochastic, and a negative MACD histogram — usually describes a market waiting for a catalyst rather than one already in motion. It is the kind of setup that can turn quickly, but only if price action starts to confirm the shift.
Volatility & Volume
Volatility is present, but not extreme. The ATR(14) of 2.34, equal to 2.3% of price, suggests moderate daily movement. That matters because it tells investors the stock can still travel meaningfully in either direction without needing a dramatic news event. The Bollinger Bands add another layer: the upper band is 111.04, the middle band is 106.82, and the lower band is 102.61, with %B at 14% and the band width at 7.9%. A narrow band width is often read as a squeeze, meaning volatility has compressed and a breakout — up or down — becomes more likely.
The direction of that breakout is not yet obvious. Price is near the lower band, which can support a rebound, but the fact that volume was 7,126,400 versus a 20-day average of 8,366,525 — about 0.9x normal — weakens the case for a strong move already underway. A rally on lighter-than-usual participation is easier to fade. The OBV is falling, which is another sign that the broader flow of shares has not yet turned supportive.
That is the key tension in the name right now: the chart is compressed, but participation is not yet confirming strength.
Key Levels & Scenarios
The immediate line in the sand is the 102.67 support, which also sits close to the 102.61 lower Bollinger band. If price holds that zone, the stock has room to rebuild toward the 106.82 SMA20, then the 111.04–111.25 resistance zone. A move through that upper band area would matter because it would show the squeeze is resolving with strength rather than just bouncing inside the range.
If 102.67 fails, the chart loses its short-term base and attention shifts to the broader 3-month low at 92.49. That would not be a prediction, but it would be the next visible reference point once the current floor gives way. The market is effectively asking whether Disney can defend the lower edge of its recent range or whether sellers still control the tape.
Technical Verdict: HOLD (wait & see)
HOLD (wait & see)
- RSI 46.9 is neutral, so momentum is not strong enough to confirm a sustained rebound.
- MACD histogram -0.594 shows bearish momentum still outweighs the signal line.
- Bollinger Bands are squeezing and price is near the lower band, which can lead to a sharp move, but volume and OBV have not confirmed direction.
Verdict invalidated if price falls below 102.67, because that would break the nearest support and weaken the current base.
- Ideal Entry Range: 102.67 to 103.82, where support and the current price overlap.
- Exit Target: 106.82 first, then 111.04 to 111.25 if strength expands.
- Stop Loss protection: below 102.61 to align with the lower Bollinger band, or below 102.67 support for a tighter risk line.
For non-traders, this means Disney is not broken, but it has not yet proved that the recent bounce is real. “The market is waiting for Disney to show its hand.”
Summary Data DIS
| Last price | 103.82 USD |
| Change 1 day / 5 days / 1 month | 1.12% / -4.39% / -3.67% |
| Trend / MA-cross | sideways / none |
| SMA20 / SMA50 | 106.82 / 102.88 |
| RSI (14) / Stochastic %K | 46.9 / 26.4 |
| Bollinger %B / ATR | 14% / 2.34 |
| Support / Resistance 20 days | 102.67 / 111.25 |
| Data as of | 21 September 2026 20:30 WIB |


