PG Stock Technicals Today: Gains 1.25%, Testing Key Resistance
On September 23, 2026: price 148.22 USD, trend sideways, RSI 50.8, support 142.64, resistance 147.64. technical analysis of pg stock. PG Stock Technicals —…

Procter & Gamble’s shares rose to 148.22 on the NYSE, up 1.25% from the previous close of 146.39, and are now pressing against the upper edge of their recent trading band. That move matters less as a headline gain than as a test of whether the stock can turn a short burst of strength into something more durable: the price is above both the SMA20 at 145.63 and the SMA50 at 146.10, while momentum readings are mixed enough to suggest the market is still deciding whether this is a real breakout or just a drift toward resistance.
Trend & Price Action
The chart shows a stock that is not in a clean uptrend or downtrend, but in a sideways pattern with a modest upward lean in the SMA20 slope of 0.52% over 5 days. That slope is important: it says the short-term trend is improving, but not forcefully enough to call it a decisive trend change. The price sitting above both moving averages is constructive because it tells us buyers have recently been willing to pay above the stock’s short- and medium-term average cost. Yet there is no new MA-cross, which means the moving averages have not delivered a fresh confirmation signal. In plain language, the chart has improved, but it has not broken into a clearly stronger regime.
The stock is also near the top of its recent range. With 20-hour support at 142.64 and 20-hour resistance at 147.64, the latest price is already above that resistance marker and sitting at 112% of the range, a sign that the market has pushed into the upper end of its recent corridor. The 3-month high of 154.32 remains overhead, while 140.20 marks the lower end of that broader window. That positioning matters because shares trading near the top of a range often need either stronger volume or a fresh catalyst to keep climbing; otherwise, they tend to stall and rotate back toward the middle.
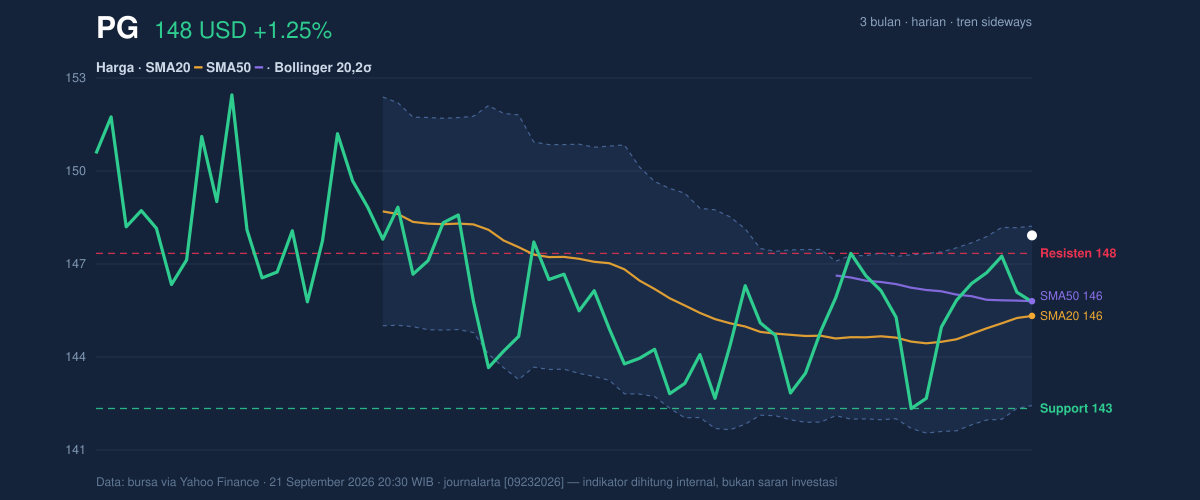
The Bollinger setup reinforces that tension. The bands are tight, with upper band at 148.52, middle band at 145.63, and lower band at 142.73, while the 4.0% band width points to a squeeze. In market terms, a squeeze means volatility has compressed, which often precedes a larger move. The signal is not directionally bullish on its own; it simply says the stock is coiled. Because the price is already at 95% of Bollinger %B, it is close to the upper band, which can indicate strength — but also a market that may be stretched in the short term.
A short move, not yet a trend.
Oscillators & Momentum
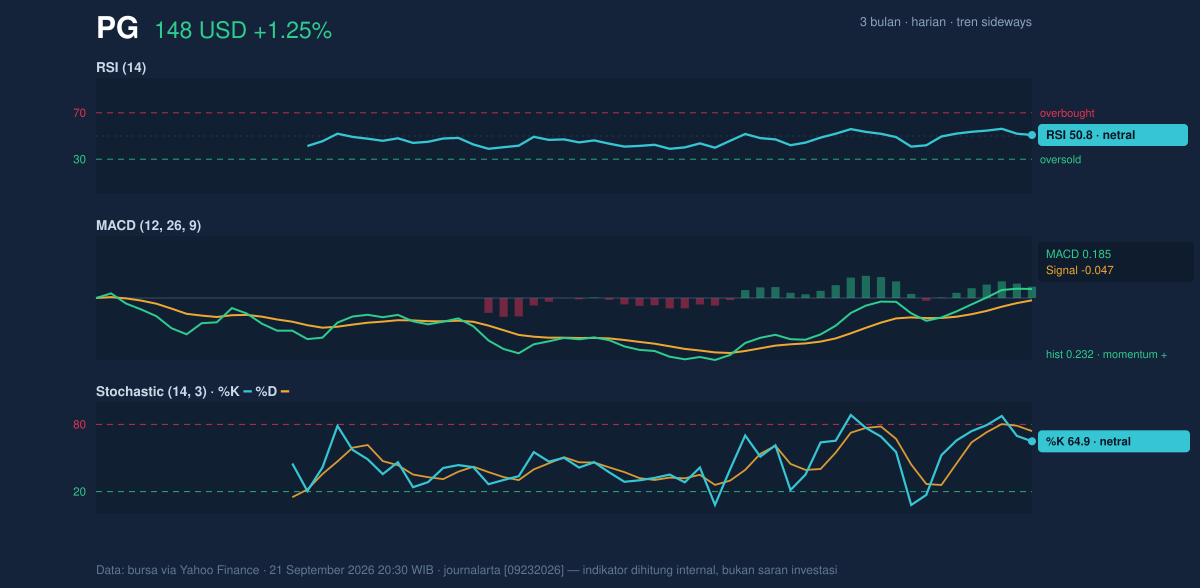
The momentum picture is more supportive than the trend picture, but still not emphatic. RSI at 50.8 is almost perfectly neutral, which usually means the stock is neither overbought nor oversold and has room to move either way. That neutrality is useful here because it leaves open the possibility of continuation without the burden of an overheated oscillator. The Stochastic %K at 64.9 and %D at 74.1 also sit in neutral territory, although %K below %D hints that short-term enthusiasm has cooled a bit from its recent peak. In simple terms, buyers are present, but they are not yet pressing with urgency.
The stronger signal comes from MACD at 0.185, above its signal line at -0.047, with a histogram of 0.232. MACD compares two moving averages and is often used to gauge whether momentum is accelerating or fading. A positive histogram means the faster line is ahead of the slower one, so upward momentum still has the edge. That said, the fact that RSI and Stochastic are neutral while MACD is positive suggests the stock has momentum, but not enough broad confirmation to call it a powerful breakout.
Volatility & Volume
Volatility is subdued. The ATR(14) of 2.18, equal to 1.5% of price, indicates the stock has been moving in relatively small daily increments. Low ATR often goes hand in hand with range trading and can also precede a volatility expansion if the squeeze resolves. The key point is that the current move has not yet been accompanied by the kind of wide daily swings that usually mark a decisive shift in sentiment.
Volume adds a subtle but important layer. The latest volume of 5,822,100 is only 0.7x normal versus the 20-hour average of 8,392,880, which means the move higher has not been powered by broad participation. That matters because breakouts driven by thin volume are more vulnerable to fading once early buyers step aside. On the other hand, OBV is rising, and that is a constructive divergence: on-balance volume tracks whether money is generally flowing into or out of a stock over time. A rising OBV while price is stable or rising suggests accumulation is still present underneath the surface, even if the latest session did not attract heavy turnover.
Key Levels & Scenarios
The market is now focused on a narrow technical corridor. The immediate ceiling is the 148.52 Bollinger upper band, closely aligned with the latest price, while the recent 147.64 resistance has already been tested and cleared intraday by the current quote. If the stock can hold above that area, the next reference point is the 154.32 three-month high. If it cannot, the first important support sits at the 145.63 SMA20, then the 142.73 Bollinger lower band and 142.64 support. A failure back below those levels would suggest the recent lift was more of a range extension than a genuine breakout.
Technical Verdict: HOLD (wait & see)
HOLD (wait & see) fits best because the chart is improving, but the confirmation is incomplete.
- MACD is positive, which shows momentum still favors the upside.
- Price is above the SMA20 and SMA50, a constructive sign for short-term structure.
- Volume is only 0.7x normal and RSI is neutral at 50.8, so the move lacks strong participation and is not yet overbought enough to force a trend call.
Verdict invalidated if price falls below 142.64, where the recent range support sits.
- Ideal Entry Range: 145.63 to 147.64, where the SMA20 and recent resistance cluster
- Exit Target: 148.52, then 154.32 if the squeeze resolves upward
- Stop Loss protection: below 142.64, with 142.73 as the nearby Bollinger support reference
In plain English: the stock is leaning firmer, but it still needs stronger proof before the move can be treated as more than a short-term bounce.
Procter & Gamble’s latest session closed with OBV rising even as volume stayed below average.
Summary Data PG
| Last price | 148.22 USD |
| Change 1 day / 5 days / 1 month | 1.25% / 1.43% / 2.45% |
| Trend / MA-cross | sideways / none |
| SMA20 / SMA50 | 145.63 / 146.10 |
| RSI (14) / Stochastic %K | 50.8 / 64.9 |
| Bollinger %B / ATR | 95% / 2.18 |
| Support / Resistance 20 days | 142.64 / 147.64 |
| Data as of | 21 September 2026 20:30 WIB |


