QCOM Stock Gains 11.56% Today, Golden Cross Formed
On September 23, 2026: price 198.27 USD, trend uptrend, RSI 65.4, support 158.53, resistance 194.23. technical analysis of qcom stock. QCOM Stock Gains — full…

Qualcomm Inc. climbed to 198.27 on NASDAQ, up 11.56% in a single session, as the chipmaker pushed decisively beyond its recent trading band and into fresh technical territory. The move matters because it was not a thin, isolated spike: volume reached 18,444,600, or about 1.3× the 20-day average, while the chart shows price now sitting above both the SMA20 at 173.95 and the SMA50 at 168.62. That combination usually signals that buyers are not just reacting to news, but are still willing to pay higher prices after the initial breakout. Yet the same chart also shows the shares are stretched well above the upper Bollinger band, which often means momentum is strong but also vulnerable to pauses.
Trend & Price Action
As shown in the chart, Qualcomm is in a clear uptrend, with the SMA20 rising 3.81% over 5 days and a golden cross in place, meaning the shorter average has moved above the longer one. In plain language, that crossover is a sign that recent price action has become stronger than the broader short-term trend, often attracting trend-following flows. The stock has also moved sharply above its 20-hour resistance at 194.23 and is trading near the top of its 3-month range, between 142.89 and 219.43. That places the share price in a zone where momentum is still dominant, but where overhead space is no longer wide.
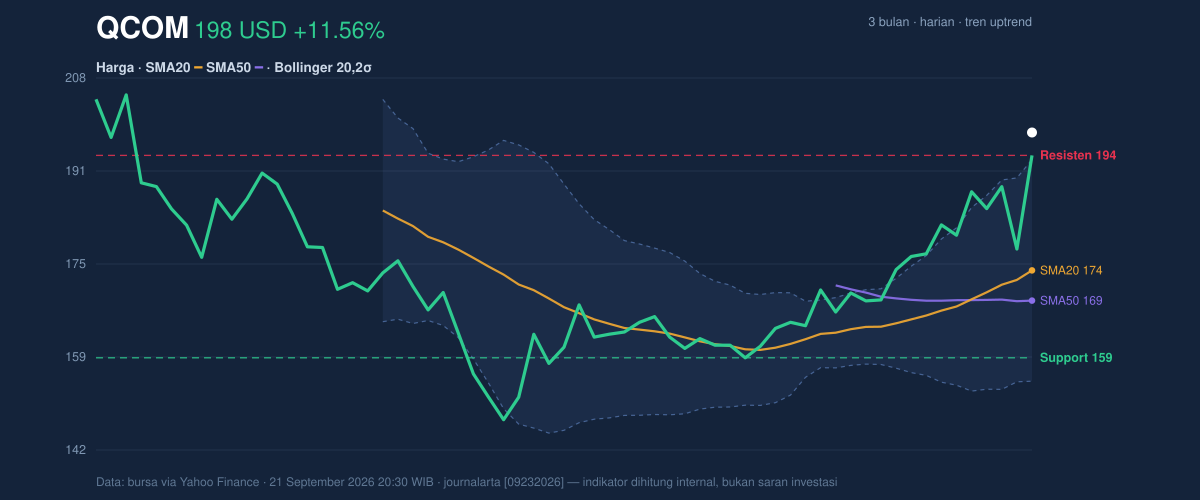
The important signal here is not just that Qualcomm is rising, but that it is rising faster than its averages can catch up. That usually supports further strength — until it doesn’t.
Oscillators & Momentum
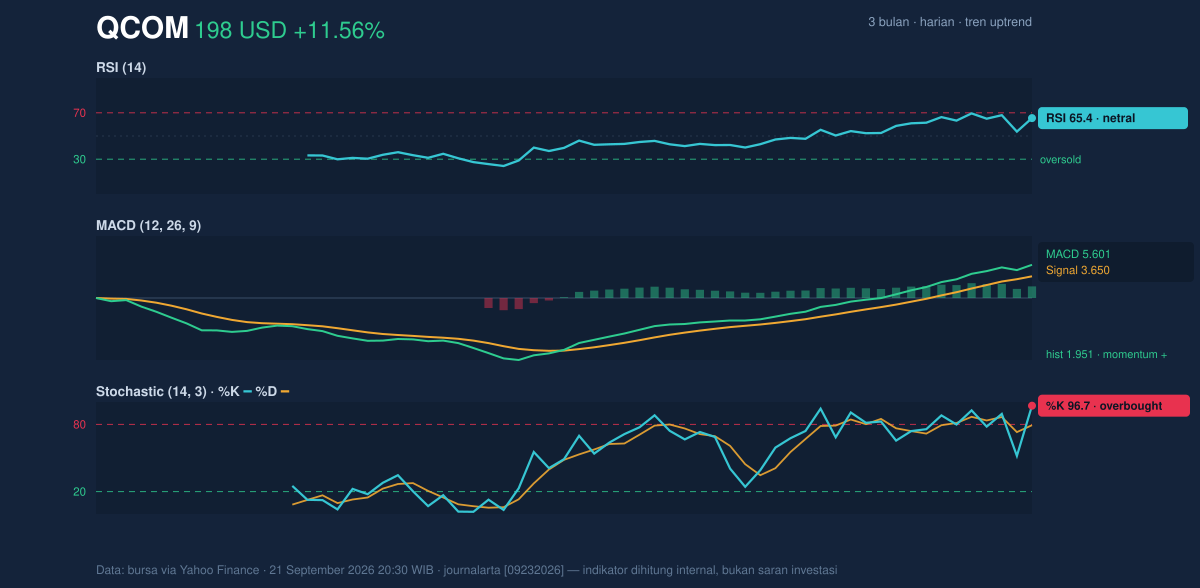
The momentum tools are mixed in a way that often appears late in a rally. The RSI at 65.4 is still neutral, which suggests the stock is not yet in a classic exhaustion zone. But the Stochastic %K at 96.7 and %D at 79.3 are overbought, showing price has advanced quickly relative to its recent range. That does not automatically mean reversal; it means short-term upside may be harder to extend without a pause or consolidation. The MACD at 5.601, above its signal line at 3.650 with a positive histogram of 1.951, still confirms upward momentum. In other words, the trend is intact, but the oscillator lineup says the move is getting mature.
This is the kind of setup where strength and fatigue can coexist.
Volatility & Volume
The Bollinger Bands add another layer to that story. Qualcomm is trading above the upper band at 193.49, with %B at 112%, which means the stock has moved beyond the normal statistical envelope of its recent price behavior. The 22.5% band width shows volatility is expanding, not contracting, so the market is prepared for larger swings rather than a quiet drift. The ATR at 9.72, or 4.9% of price, reinforces that point: daily moves are now large enough that even healthy trends can retrace sharply.
Volume and OBV still lean constructive. Trading activity came in above average, and OBV is rising, which suggests the breakout has broad participation rather than being driven by a few isolated prints. That matters because a price move above resistance is more credible when volume confirms it. Without that confirmation, breakouts often fade quickly. Here, participation is visible — but so is the risk of a short-term pullback after such a steep rise.
Key Levels & Scenarios
The nearest technical reference points are clear. The 20-hour support at 158.53 is the main floor from the data set, while the 20-hour resistance at 194.23 has already been cleared. Since price is now trading above that ceiling and near the upper Bollinger band, the next question is whether the breakout can hold or whether the market will retest the prior resistance as support. If the shares stay above 194.23, the chart suggests the breakout remains valid. If they slip back below that level, it would signal the move may be losing immediate traction. A deeper loss of the SMA20 at 173.95 would weaken the current trend structure more meaningfully.
The signal is strong, but it is extended.
Technical Verdict: HOLD (wait & see)
HOLD (wait & see)
- MACD remains positive, with the line above signal and a positive histogram, which supports the breakout.
- Golden cross and price above SMA20/SMA50 confirm the broader short-term trend is still upward.
- Stochastic is overbought and price is above the upper Bollinger band, so near-term upside may be vulnerable to a pause.
Verdict invalidated if price falls below 173.95, the SMA20, because that would weaken the current trend structure and suggest the breakout is failing.
- Ideal Entry Range: between 173.95 and 194.23, where prior resistance and the short-term trend line up
- Exit Target: 219.43, the 3-month high
- Stop Loss protection: below 158.53, the 20-hour support
For non-traders, that means the stock is strong, but it has already run far enough that the next move may be more about holding gains than chasing them.
Qualcomm’s 3-month high stands at 219.43.
Summary Data QCOM
| Last price | 198.27 USD |
| Change 1 day / 5 days / 1 month | 11.56% / 10.06% / 23.34% |
| Trend / MA-cross | uptrend / golden |
| SMA20 / SMA50 | 173.95 / 168.62 |
| RSI (14) / Stochastic %K | 65.4 / 96.7 |
| Bollinger %B / ATR | 112% / 9.72 |
| Support / Resistance 20 days | 158.53 / 194.23 |
| Data as of | 21 September 2026 20:30 WIB |


