AMD Stock Technicals Today: Gains 11.42%, RSI Overbought
On September 23, 2026: price 623.77 USD, trend uptrend, RSI 73.0, support 456.16, resistance 615.52. technical analysis of amd stock. AMD Stock Technicals —…

AMD’s latest surge has pushed the chipmaker into fresh territory, but the speed of the move is now as important as the direction. Shares of Advanced Micro Devices on the Nasdaq closed at USD 623.77, up 11.42% on the day and extending gains to 26.42% over five days and 31.81% over one month, according to Yahoo Finance data for 21 September 2026, 20:30 WIB. That kind of acceleration signals strong demand, yet it also leaves the stock stretched well beyond its recent trading range, where momentum and caution are now colliding.
Trend & Price Action
The chart shows a clear trend break in AMD’s favor. The share price is trading above SMA20 at 497.87 and SMA50 at 497.00, while the shorter average has crossed above the longer one in a golden cross. In plain terms, that crossover often tells traders that recent buying pressure has overtaken the slower-moving trend, and it usually matters more when the averages are both rising rather than flattening out.
That is the case here. The reported uptrend is backed by a 3.51% five-day slope in SMA20, which means the trend line itself is still climbing rather than merely being dragged higher by one or two outsized sessions. The problem is positioning: AMD is now sitting at 105% of its 20-hour range, with the 20-hour resistance at 615.52 already passed and the three-month high at 616.69 also exceeded. When a stock trades above its recent ceiling and keeps going, it often shows that buyers are in control — but it can also mean the move is becoming vulnerable to profit-taking because the market has little overhead reference left.
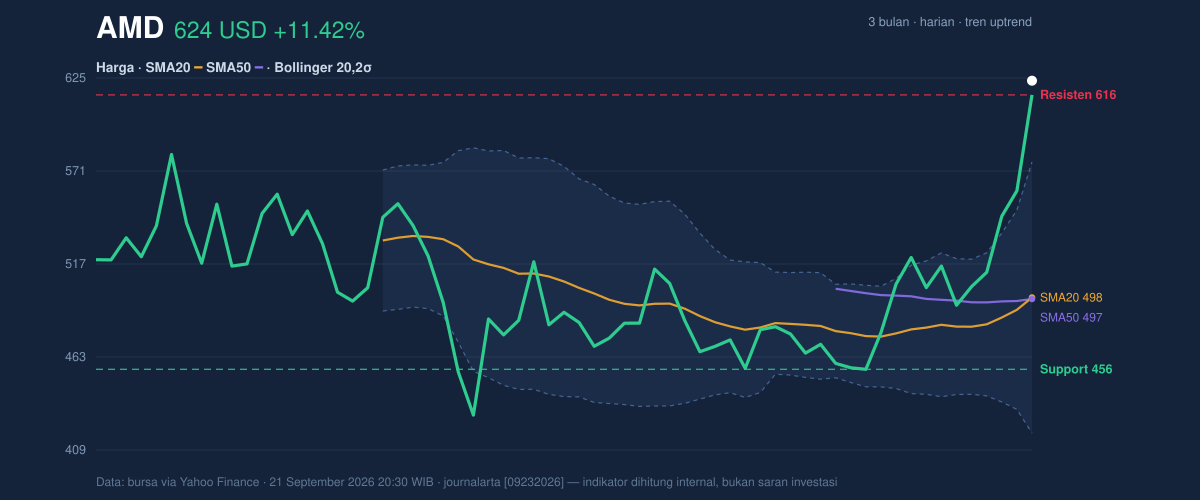
The Bollinger bands underline that tension. The upper band sits at 576.59, yet AMD is trading above it with %B at 130%. For general readers, that means price is not just near the top of its normal range; it is beyond it. Combined with a 31.6% band width, this points to a market that is both stretched and volatile. The message is not that the trend has failed. It is that the stock has moved fast enough to force the next session to prove whether this is a breakout or a temporary overshoot.
Oscillators & Momentum
Momentum indicators are still positive, but they are flashing a warning label. The RSI(14) at 73.0 and Stochastic %K at 99.3 / %D at 97.9 both sit in overbought territory. In practical terms, that does not automatically mean the stock must fall. It means the recent advance has been so strong that the market may be running ahead of its own short-term balance, leaving less room for error if buying slows.
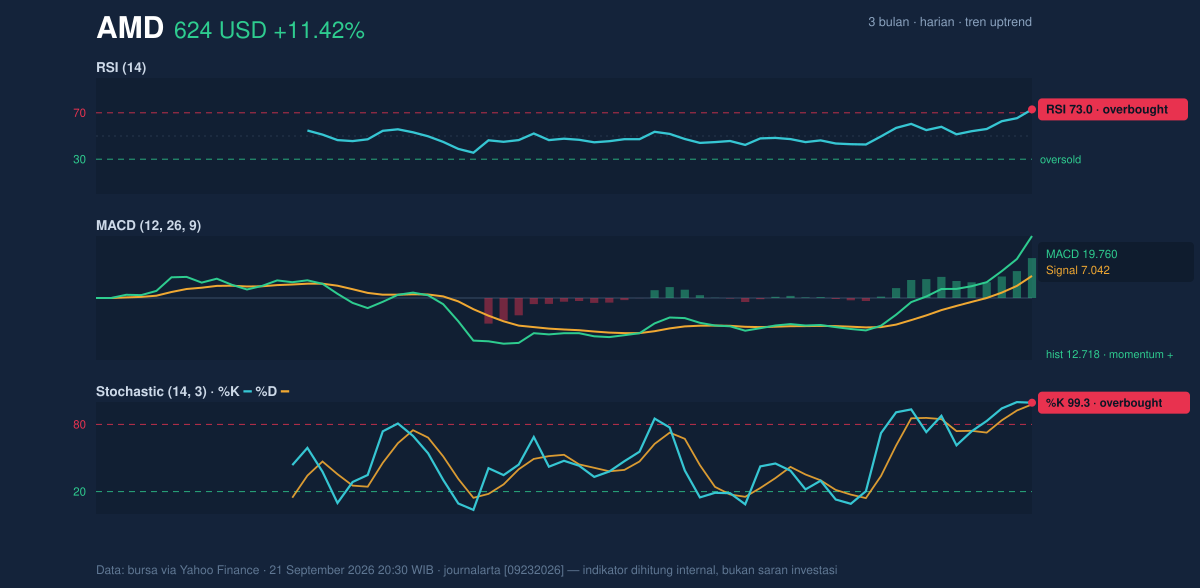
The MACD at 19.760 remains above the signal line at 7.042, with a 12.718 histogram. That is important because MACD is still confirming upward momentum rather than diverging from it. The histogram, which measures the gap between the two lines, suggests the trend is still expanding rather than fading. So while RSI and Stochastic say the stock is hot, MACD says the heat is still being fed by buyers. That combination often appears late in a strong run: momentum remains intact, but the market is closer to a pause than it was a week ago.
Volatility & Volume
Volume is reinforcing the move rather than questioning it. The latest session traded 44,494,300 shares, about 2.2 times the 20-session average of 20,568,375, and OBV is rising. That matters because a rally on thin participation can be fragile, while a rally on heavy volume usually indicates broader conviction. Here, the surge in turnover suggests institutions and larger traders were involved, not just short-term momentum chasing.
At the same time, the ATR(14) of 25.52, equal to 4.1% of price, shows the stock is moving with wide daily swings. ATR is a measure of typical price movement, so a higher reading means traders should expect larger gaps between the day’s high and low. In a stock already trading above its upper Bollinger band, elevated ATR raises the odds of sharp intraday reversals even if the broader trend remains upward.
Key Levels & Scenarios
The immediate technical map is now very clear. The first meaningful floor is 615.52, the 20-hour resistance that has just been overtaken. Below that, 576.59 — the Bollinger upper band — becomes the first zone where a pullback could find support if momentum cools. A deeper cushion sits at 497.87, the SMA20 and Bollinger middle band, which also aligns closely with the SMA50 at 497.00. That cluster is important because it marks the center of the current trend structure.
On the downside, the 456.16 support level remains the key line of defense from the 20-hour range. If that fails, the market would be signaling that the recent breakout has lost its base. On the upside, the stock is already above the three-month high of 616.69, so the next sessions are less about resistance and more about whether price can hold above the prior ceiling and convert it into support.
Technical Verdict: HOLD (wait & see)
HOLD (wait & see)
- RSI at 73.0 and Stochastic at 99.3/97.9 show the stock is overbought, so the rally is strong but extended.
- MACD remains positive and volume is 2.2× average, which confirms the breakout has real participation.
- Price above SMA20/SMA50 with a golden cross supports the trend, but %B at 130% and the move beyond the upper Bollinger band suggest the stock may need to cool before the next leg.
Verdict invalidated if price falls below 456.16, because that would break the nearest listed support and weaken the breakout structure.
- Ideal entry range: 576.59 to 615.52, where the stock could retest the upper band or former resistance after cooling.
- Exit target: 623.77 as the current reference area, with 616.69 as the prior three-month high now surpassed.
- Stop loss protection: 456.16, the nearest support from the 20-hour range.
For non-traders: AMD is still in a strong uptrend, but it has risen so fast that the next move will matter more than the last one.
“We’re seeing powerful momentum, but the market now has to prove this isn’t just a sprint that ran too far, too fast.”
Summary Data AMD
| Last price | 623.77 USD |
| Change 1 day / 5 days / 1 month | 11.42% / 26.42% / 31.81% |
| Trend / MA-cross | uptrend / golden |
| SMA20 / SMA50 | 497.87 / 497.00 |
| RSI (14) / Stochastic %K | 73.0 / 99.3 |
| Bollinger %B / ATR | 130% / 25.52 |
| Support / Resistance 20 days | 456.16 / 615.52 |
| Data as of | 21 September 2026 20:30 WIB |


