Momentum Gains, LLY Stock Gains 1.49% Today
On September 23, 2026: price 1,170.14 USD, trend sideways, RSI 51.3, support 1,115.70, resistance 1,246.93. technical analysis of lly stock.

Eli Lilly shares rose to 1,170.14 USD on the NYSE, up 1.49% from the previous close, but the move still sits inside a broader sideways pattern, according to data from Yahoo Finance. That matters because the stock is not breaking into a fresh trend yet; instead, it is trying to recover from a -6.79% one-month slide while holding above its short-term average. The message from the tape is cautious improvement rather than full conviction.
Trend & Price Action
The first signal is the stock’s position relative to its moving averages. Eli Lilly is trading above the SMA20 at 1,158.79, which suggests the most recent bounce has enough force to lift price back over the short-term trend line. But it remains below the SMA50 at 1,176.89, which is important: the medium-term trend is still acting as a lid, and the share price is not yet fully reclaiming that slower average.
That split tells a simple story. Buyers have enough control to prevent a deeper slide for now, but they have not yet proven they can sustain a stronger advance through the next layer of overhead supply. The chart also shows no new moving-average crossover, so there is no fresh trend reversal signal to lean on. With the SMA20 slope down 1.88% over 5 days, the short-term structure is still easing, even if the latest session improved.
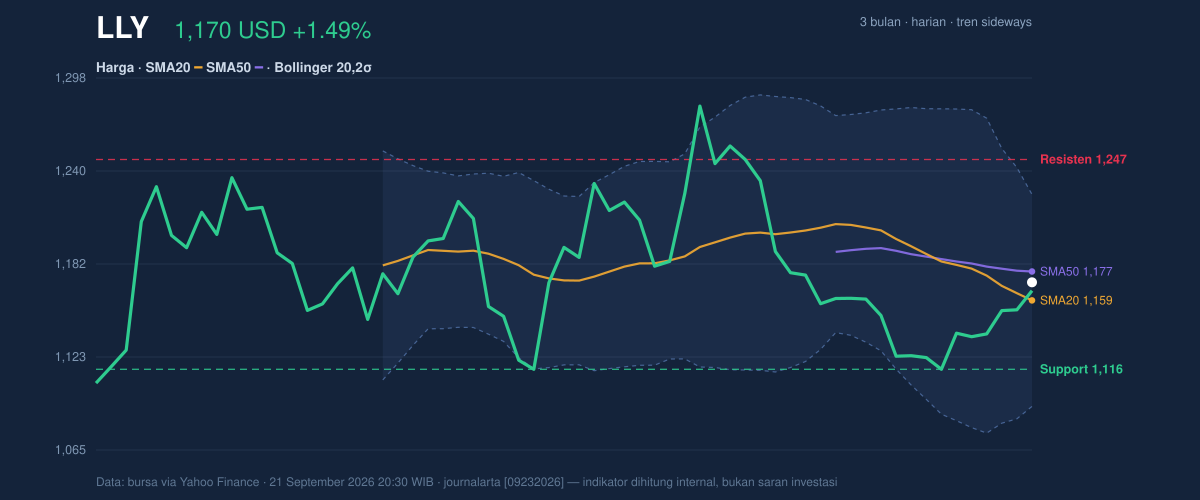
The stock is also trading at about 41% of its 20-day range, between support at 1,115.70 and resistance at 1,246.93. That placement is neither weak nor strong; it sits closer to the lower half of the band, which means the market is still rebuilding after the recent pullback rather than pressing into breakout territory. The broader three-month range reinforces that view, with the share price well below the 3-month high of 1,292.65 but still above the 3-month low of 1,079.22.
Oscillators & Momentum
Momentum indicators are more constructive than the trend line alone suggests. The RSI at 51.3 is neutral, which usually means the stock is not stretched in either direction. In plain English, it is not overbought and not oversold; it has room to move either way depending on whether buyers or sellers gain the upper hand next.
The stochastic reading is also in neutral territory, with %K at 68.8 and %D at 57.9. That positioning leans toward the upper end of neutral, which often indicates improving short-term momentum without yet flashing a full exhaustion signal. It is a useful distinction: the stock is not overheated, but it is also not deeply discounted.
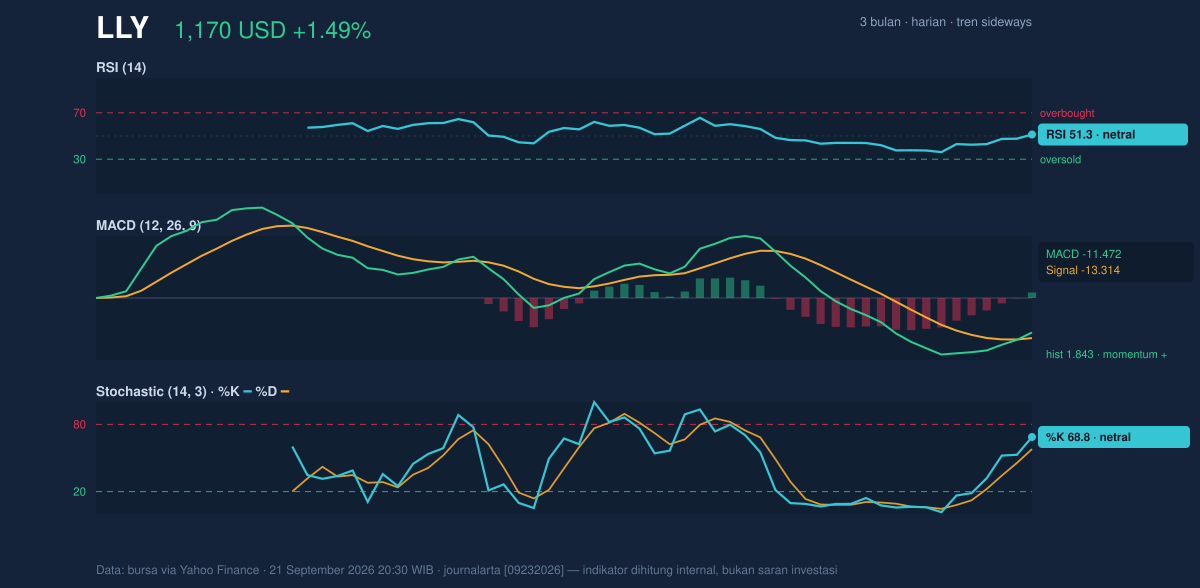
The more encouraging piece comes from MACD at -11.472, above the signal line at -13.314, with a positive histogram of 1.843. For readers less familiar with the term, MACD is a trend-following momentum gauge; when it rises above its signal line, it suggests the recent pace of selling is fading and momentum is turning more favorable. The fact that the histogram is positive means that shift is already underway, even though the MACD line itself remains below zero. In other words, the stock is improving from a weak base, not yet charging into a strong uptrend.
Volatility & Volume
Volatility is present, but not extreme. The ATR(14) of 26.14, equal to 2.2% of price, points to moderate daily movement. That typically means the shares can still travel meaningfully in either direction, but the market is not in a panic phase. The Bollinger Bands tell a similar story: the band width is 11.4%, described as normal, which suggests no compression setup or volatility shock is dominating the chart. Price sits at %B 59%, just above the middle of the band. That is a technical way of saying the stock is trading slightly above the center of its recent volatility envelope, not near the upper edge where momentum would look extended.
Volume adds another layer. Last trade volume was 2,476,600, roughly 1.0x normal versus the 20-day average of 2,373,105. That is enough to say the day’s move was not hollow, but it was not a surge of aggressive participation either. Still, OBV is rising, and that matters because on-balance volume tracks whether money flow is quietly accumulating or distributing. Rising OBV alongside a price rebound suggests the latest lift is being supported by participation, even if it is not yet dramatic.
Key Levels & Scenarios
The immediate technical map is clear. Support at 1,115.70 is the first line the market needs to defend. A failure there would expose the lower part of the recent range and raise the risk of another test toward the 3-month low at 1,079.22. On the upside, resistance at 1,246.93 is the first meaningful ceiling. Above that, the next important reference is the Bollinger upper band at 1,225.11, which price is already approaching from below in the broader structure, and then the higher resistance zone that has capped the recent range.
A move through 1,176.89 would matter because it would reclaim the SMA50, a sign that the stock is not just bouncing but beginning to repair its medium-term trend. Until then, the chart says recovery is real but incomplete.
Technical Verdict: HOLD (wait & see)
HOLD (wait & see)
- RSI at 51.3 and stochastic at 68.8/57.9 are neutral, so momentum is improving but not decisive.
- MACD is still below zero, even though the histogram is positive at 1.843, which signals recovery from weakness rather than a confirmed trend reversal.
- Price is above the SMA20 but still below the SMA50, and the trend remains sideways with a down-sloping short average.
Verdict invalidated if price falls below 1,115.70 and fails to hold that support.
- Ideal Entry Range: 1,115.70 to 1,158.79
- Exit Target: 1,225.11 to 1,246.93
- Stop Loss protection: below 1,092.46
For non-traders, this means Eli Lilly is showing repair, but not yet enough proof that the rebound has become a lasting advance.
Summary Data LLY
| Last price | 1,170.14 USD |
| Change 1 day / 5 days / 1 month | 1.49% / 2.80% / -6.79% |
| Trend / MA-cross | sideways / none |
| SMA20 / SMA50 | 1,158.79 / 1,176.89 |
| RSI (14) / Stochastic %K | 51.3 / 68.8 |
| Bollinger %B / ATR | 59% / 26.14 |
| Support / Resistance 20 days | 1,115.70 / 1,246.93 |
| Data as of | 21 September 2026 20:30 WIB |


