OCBC Stock Analysis: Gains 1.48%, Testing Key Resistance
On September 23, 2026: price 32.14 SGD, trend uptrend, RSI 62.5, support 30.90, resistance 32.27. technical analysis of ocbc stock. OCBC Stock Analysis — full…

OCBC Bank’s shares rose to 32.14 SGD on SGX, up 1.48% from the previous close of 31.67, with the move extending a 3.68% gain over five days. The stock is trading near the upper end of its recent band, and that matters: it is not just rising, it is doing so while sitting close to the ceiling of a short-term range, which often tells traders the market is testing whether the latest advance has enough force to become something more durable.
Trend & Price Action
The chart shows OCBC holding in an uptrend, with the 20-day moving average rising at 0.40% over five days. Price is above both the SMA20 at 31.54 and the SMA50 at 30.49, which is a constructive structure because shorter-term trading is still above the medium-term base. There is no fresh MA-cross, so the message is not a sudden trend reversal but a continuation of an existing upward bias.
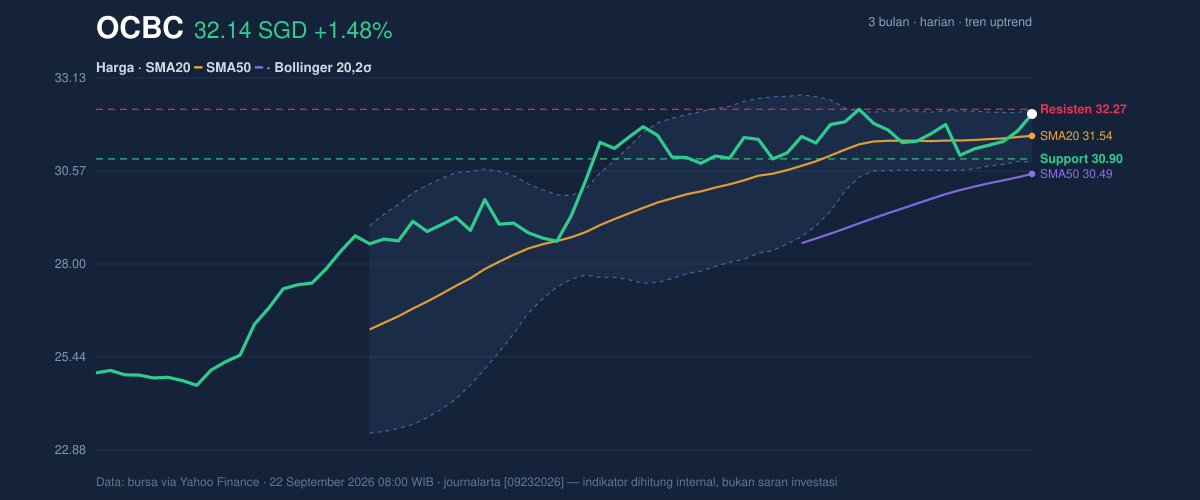
Just as important, the stock is trading at 91% of its 20-hour range, with support at 30.90 and resistance at 32.27. That positioning signals strength, but it also means the market is pressing against a level where some traders may choose to lock in gains. The 3-month high at 32.57 sits only slightly above the current price, so the move is close to a prior peak rather than in open price discovery. In plain terms, the shares are advanced, but they are now meeting an area where the next push has to prove itself.
Oscillators & Momentum
Momentum is less straightforward than the price trend. The RSI at 62.5 is still in neutral territory, which means the stock is not yet showing the kind of stretched condition that usually warns of an immediate reversal. The Stochastic %K at 73.0 versus %D at 47.2 points to short-term strength, but not an overheated reading on its own. Together, these two indicators suggest buyers remain active without the stock being fully overbought.
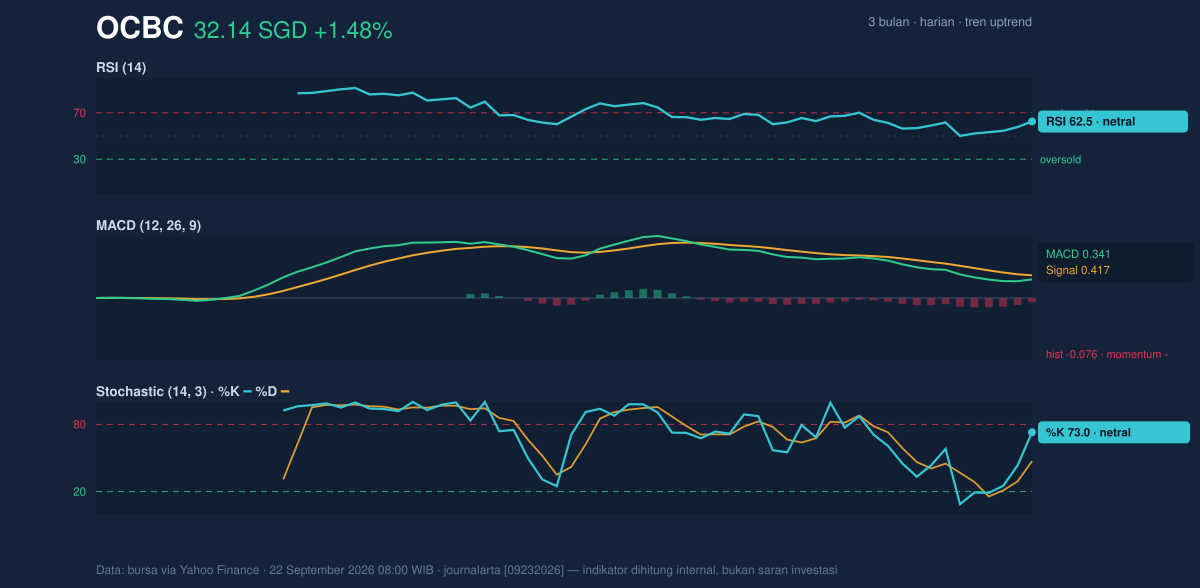
The caution flag comes from the MACD at 0.341 versus its signal line at 0.417, leaving a -0.076 histogram. That negative histogram means the faster trend line is still below the signal line, so the recent lift in price has not yet been fully confirmed by momentum. This is the kind of setup that often appears when price is climbing ahead of momentum: the chart looks firm, but the engine underneath is not accelerating as cleanly as the headline move suggests.
Volatility & Volume
Bollinger Bands give the clearest read on the current tension. Price is near the upper band at 32.26, with %B at 91%, showing the stock is trading close to the top of its recent volatility envelope. At the same time, the band width is only 4.6%, described as a squeeze, which usually means volatility has compressed and the market may be preparing for a larger move. Squeezes do not tell direction by themselves, but they often act like a coiled spring: the tighter the range, the more forceful the break can be once price leaves it.
Volume adds some confirmation. The latest turnover of 7,183,000 is about 1.2× normal versus the 20-hour average of 5,819,262, and OBV is rising. That combination suggests the advance is not happening on empty participation. Rising on above-average volume is usually healthier than drifting upward on thin trading, because it implies more market interest is backing the move.
Key Levels & Scenarios
The nearest line in the sand is 32.27, the 20-hour resistance and just above the current price. A clean break above that level would bring the 32.57 3-month high into view as the next obvious reference point. If price fails there, the more important check is whether 30.90 support holds; that is the level that would tell the market whether this is a controlled pause or the start of a deeper retracement.
The Bollinger middle band at 31.54 also matters as a dynamic pivot. Holding above it would keep the short-term trend intact, while slipping below it would suggest the recent strength is fading back toward the center of the range. With ATR at 0.50, or 1.6% of price, daily swings are moderate rather than explosive, so moves through these levels may still unfold in measured steps rather than in a single sharp break.
Technical Verdict: HOLD (wait & see)
HOLD (wait & see) — the price trend is constructive, but momentum is not fully aligned yet.
- Reason 1: Price is above the SMA20 at 31.54 and SMA50 at 30.49, confirming an established uptrend.
- Reason 2: Bollinger squeeze at 4.6% plus %B at 91% shows the stock is compressed but already near the upper band, so follow-through still needs confirmation.
- Reason 3: MACD remains negative on the histogram, which means momentum has not fully caught up with the recent price rise.
- Verdict invalidated if price breaks below 30.90, which would mean the nearest support has failed and the short-term structure is weakening.
- Ideal Entry Range: 31.54 to 30.90
- Exit Target (Target Price): 32.27, then 32.57
- Stop Loss protection: below 30.90
For non-traders, this means the stock is still trending upward, but the next move needs confirmation before the chart looks decisively stronger.
Summary Data OCBC
| Last price | 32.14 SGD |
| Change 1 day / 5 days / 1 month | 1.48% / 3.68% / 2.06% |
| Trend / MA-cross | uptrend / none |
| SMA20 / SMA50 | 31.54 / 30.49 |
| RSI (14) / Stochastic %K | 62.5 / 73.0 |
| Bollinger %B / ATR | 91% / 0.50 |
| Support / Resistance 20 days | 30.90 / 32.27 |
| Data as of | 22 September 2026 08:00 WIB |



