Testing Support Level, Singtel Stock Drops 0.23% Today
On September 23, 2026: price 4.32 SGD, trend sideways, RSI 35.3, support 4.32, resistance 4.56. technical analysis of singtel stock. Testing Support Level —…

Singapore Telecom’s shares on SGX slipped to SGD 4.32, edging below the previous close of 4.33 as the stock stayed pinned at the bottom of its recent trading range, according to Yahoo Finance data cited from the exchange. The move is small in isolation, but the signal is more important than the size: Singtel is trading below its SMA20 of 4.47 and just under the lower Bollinger band at 4.33, which shows the market has been leaning weak enough to press the price to the edge of its short-term statistical range. That matters because when a large-cap defensive name sits under near-term averages while the broader trend is only sideways, investors are usually watching for either a stabilising base or a deeper break.
Trend & Price Action
The stock’s broader structure is still sideways, but the slope of the SMA20 at -0.39% over 5 days shows the short-term bias has turned down. That is not a full trend reversal, yet it does tell readers that recent trading has been softer than the medium-term average. The price is also sitting below the SMA50 at 4.44, so both the faster and slower moving averages are now overhead resistance rather than support.
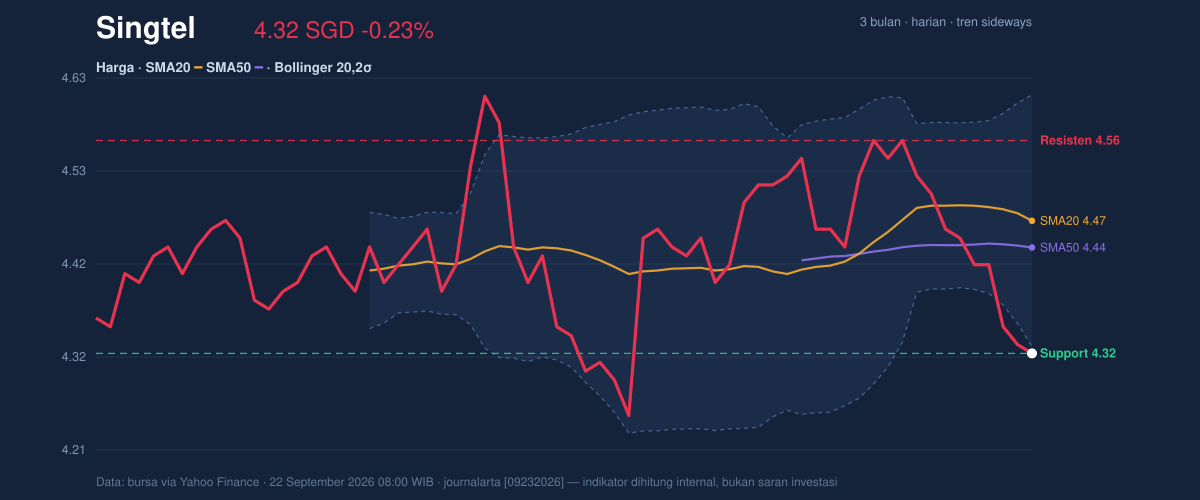
The chart matters here because it shows Singtel at the very bottom of its 20-hour range, with support at 4.32 and resistance at 4.56. In plain language, the stock is currently priced where buyers have most recently tried to defend it, but there is little evidence yet that they are doing so aggressively. The 3-month low is 4.19 and the 3-month high is 4.70, so the current level is closer to the lower end of that band than the upper end, reinforcing the idea that the market is still pricing in caution rather than recovery.
Oscillators & Momentum
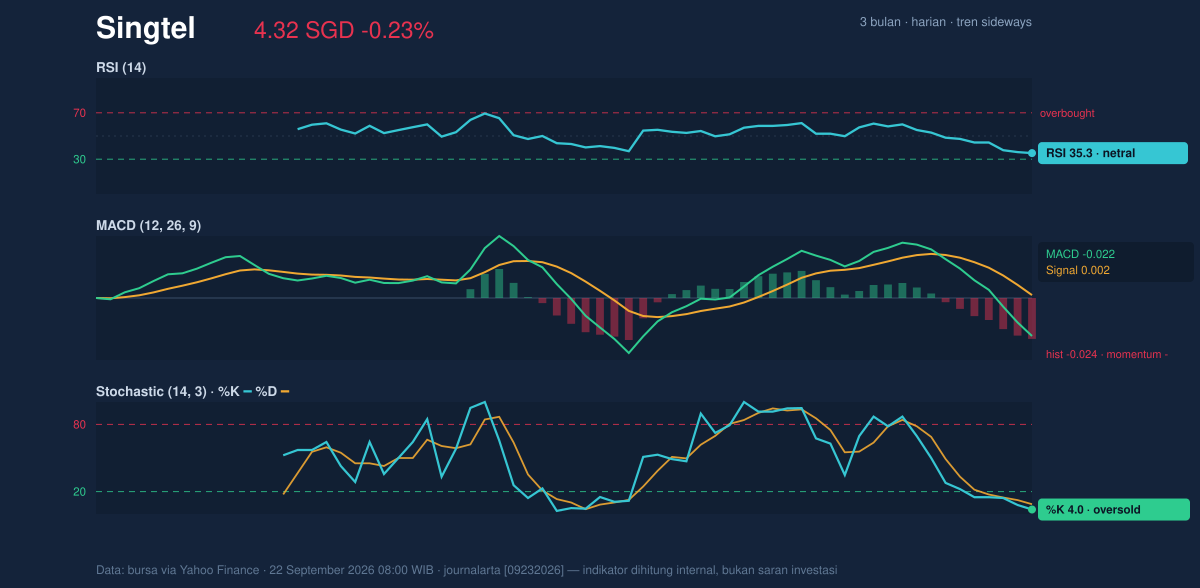
Momentum signals are mixed, but the mix is leaning weak. The RSI at 35.3 is technically still in neutral territory, yet it is near the lower edge of that zone, which usually means selling pressure has been persistent without becoming deeply washed out. By contrast, the Stochastic %K at 4.0 and %D at 8.8 are clearly in oversold territory, suggesting the stock has been moving down fast enough that short-term traders may start looking for a rebound.
That rebound signal is not fully confirmed, though, because the MACD at -0.022 remains below its signal line at 0.002, with a histogram of -0.024. In practical terms, that means downside momentum is still ahead of upside momentum. Oversold oscillators can flag a bounce, but when MACD stays negative, the market is often saying the bounce has not yet earned trust.
Volatility & Volume
The Bollinger band width of 6.4% is narrowing, which points to a squeeze and a possible expansion in either direction. This is an important setup: a quiet market often precedes a sharper move, but the direction depends on whether price can reclaim the middle band or instead lose the current floor. With the middle band at 4.47 still above the share price, Singtel would need a cleaner recovery to shift the short-term tone.
Volatility itself is not extreme. The ATR of 0.07 equals about 1.6% of price, so daily movement is moderate rather than disorderly. That means the stock is not behaving like a high-beta name in panic mode; it is drifting lower in an orderly way, which is often more frustrating than dramatic. Volume adds another cautionary layer. Last trade volume of 18,557,200 was only 0.9× normal, and OBV is falling, which suggests distribution has been stronger than accumulation. In other words, the decline is not being met by convincing buying interest.
Key Levels & Scenarios
The immediate battleground is clear. 4.32 is the key near-term support, and the next visible ceiling is 4.56. If the stock can recover back above 4.33 and then reclaim the 4.47 SMA20, the chart would begin to look less fragile because price would be moving back through the area where short-term traders typically reassess direction. If it cannot, the burden stays on the bulls, and the market may continue to test whether the 3-month low at 4.19 becomes relevant again.
The strongest clue from the chart is that Singtel is not in a clean downtrend, but it is also not yet showing the kind of momentum repair that would normally mark a durable turn. The stock is compressed near support, momentum remains negative, and volume is not confirming a base. That combination points to a market waiting for proof rather than paying up for hope.
Technical Verdict: HOLD (wait & see)
HOLD (wait & see)
- MACD is still negative, so downside momentum has not fully faded.
- Price remains below SMA20 and SMA50, which keeps the short-term structure under pressure.
- Stochastic is oversold and Bollinger bands are squeezing, so a rebound is possible, but it is not confirmed.
- Invalidation: this verdict is invalidated if price breaks below 4.32, because that would mean the current support has failed.
- Ideal entry range: 4.32 to 4.44, where support and the SMA50 cluster.
- Exit target: 4.47 to 4.56, aligned with the SMA20 and resistance.
- Stop loss protection: below 4.32, with the next downside reference at 4.19.
For non-traders, this means the shares are at a level where a bounce is possible, but the chart still needs proof before the weakness can be considered over.
Summary Data Singtel
| Last price | 4.32 SGD |
| Change 1 day / 5 days / 1 month | -0.23% / -2.92% / -3.79% |
| Trend / MA-cross | sideways / none |
| SMA20 / SMA50 | 4.47 / 4.44 |
| RSI (14) / Stochastic %K | 35.3 / 4.0 |
| Bollinger %B / ATR | -3% / 0.07 |
| Support / Resistance 20 days | 4.32 / 4.56 |
| Data as of | 22 September 2026 08:00 WIB |



