UOB Stock Gains 1.66% Today, Testing Key Resistance
On September 23, 2026: price 42.80 SGD, trend sideways, RSI 60.6, support 40.64, resistance 42.80. technical analysis of uob stock. UOB Stock Gains — full…

United Overseas Bank rose to SGD 42.80 on the SGX on 22 September 2026, up 1.66% from the previous close, and the move matters because it pushed the stock to the very top of its recent trading range, as shown in the chart. The shares are still described as sideways, but the latest price action is not random: it is pressing against the upper edge of a tightening band, with volume and momentum now doing more of the work than the longer-term trend.
Trend & Price Action
The first signal is that UOB is trading above the SMA20 at 41.55, while the SMA50 sits at 42.16. In plain terms, the short-term trend has improved enough to reclaim the shorter average, but the stock has not yet established a clean break above the medium-term average, which is why the broader picture still reads as sideways rather than decisively bullish. There is no new MA cross, so the chart is not flashing a classic trend-change signal yet.
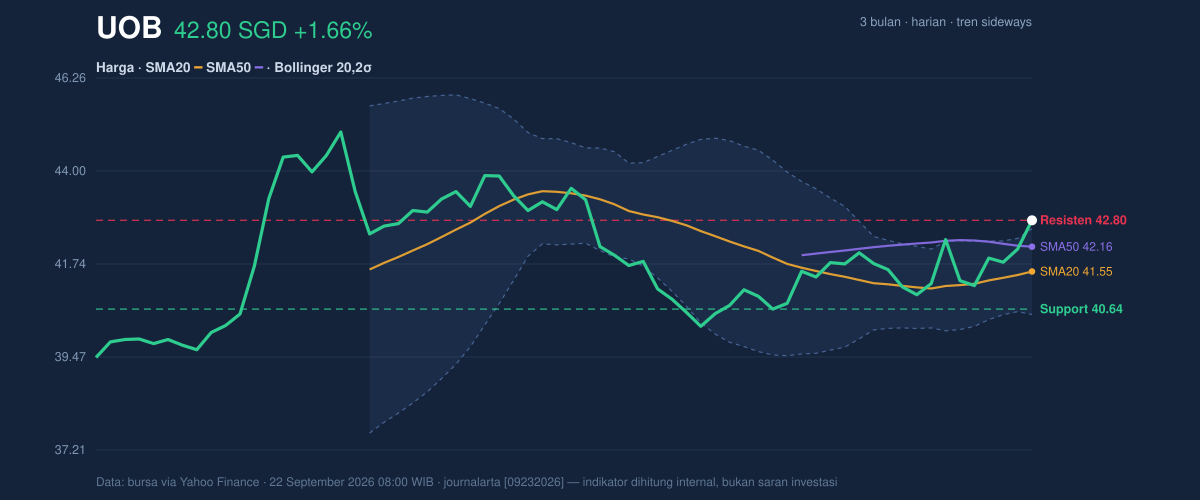
The more important detail is where the price sits relative to the range. UOB is at 100% of its 20-session range, with support at 40.64 and resistance at 42.80. That tells readers the stock has already used up the day’s available room and is now testing whether demand can keep extending the move. The 3-month high of 45.15 remains the overhead reference point, while 39.20 is the lower boundary that marks where the recent structure would start to look much weaker.
Oscillators & Momentum
Momentum is firmer than the headline trend label suggests. The MACD at 0.106, above its signal line at -0.045, with a histogram of 0.150, indicates positive momentum is still building rather than fading. For non-specialists, that means the recent rise is being confirmed by the trend-following indicator, not just by a one-day price spike.
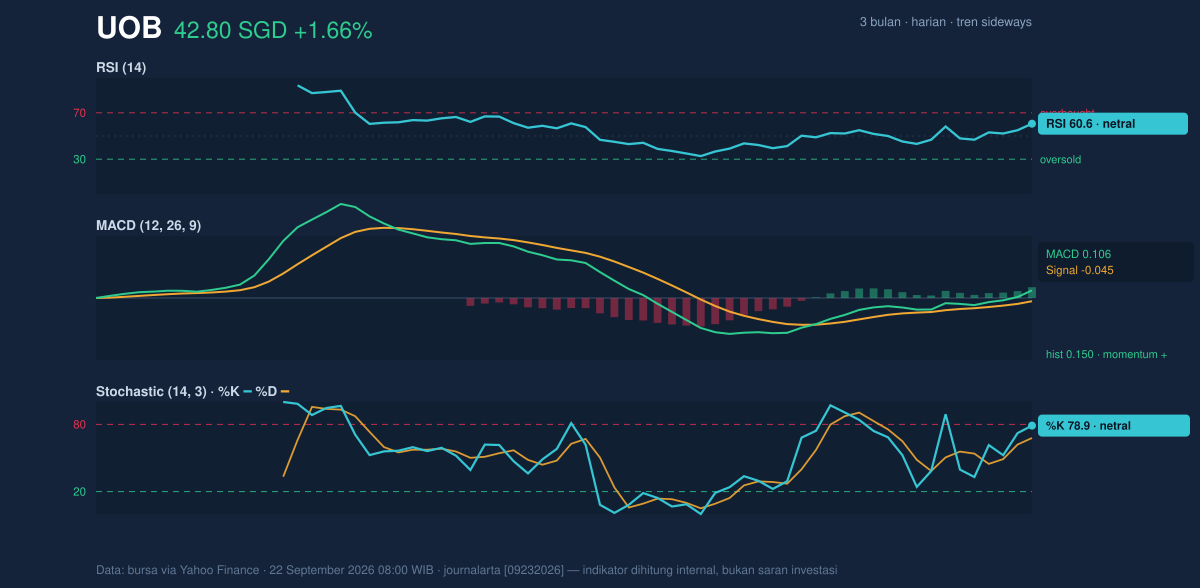
The shorter-cycle oscillators are less dramatic but still constructive. RSI at 60.6 is in the neutral zone, which matters because it suggests the stock is not yet stretched into an obviously overheated reading. Stochastic %K at 78.9 and %D at 67.9 are closer to the upper end of the scale, showing the shares are near the stronger part of their recent swing, but not in the kind of extreme that usually screams exhaustion on its own. Put simply, UOB has momentum, but the oscillators are not yet warning that the move has become overdone.
Volatility & Volume
The Bollinger setup is the most interesting part of the chart. UOB is trading above the upper band at 42.60, with %B at 110%, which means the price has pushed beyond the top of the recent volatility envelope. That often signals strength, but it can also mean the stock is temporarily overextended and may need either consolidation or a fresh burst of buying to justify further upside. The band width of 5.0% is narrowing, so the market is in a squeeze phase that can precede a breakout; squeezes do not predict direction, but they do tell traders that the next meaningful move may be larger than the recent day-to-day drift.
Volume confirms that the move has participation behind it. The latest turnover of 6,231,800 is about 2.1 times the 20-session average of 2,978,503, and OBV is rising. In technical terms, that is important because price advances backed by heavier volume usually carry more credibility than thin, unsupported spikes. It suggests institutions or larger holders were active enough to make the move count, rather than letting it fade on light trading.
Key Levels & Scenarios
The immediate question is whether UOB can hold above the upper band and turn it into support. If the stock stays above 42.60, the chart argues that the market is attempting a continuation rather than a false breakout. If it slips back below the band and loses 42.16, the message becomes less convincing, because price would be surrendering the medium-term average as well as the recent momentum edge. A break toward 40.64 would then shift attention back to the lower part of the recent range.
The stock’s position at the top of its 20-session range also means upside and downside are now more clearly defined. The recent 3-month high of 45.15 is the next visible ceiling if momentum extends, while 39.20 remains the deeper support reference if the squeeze resolves to the downside. As shown in the chart, the current setup is less about predicting direction and more about watching which side of the range gives way first.
Technical Verdict: HOLD (wait & see)
HOLD (wait & see) is the cleanest verdict because the stock is showing improving momentum, but it is also pressing against resistance after a fast move, and the trend is still officially sideways.
- MACD is positive, with the histogram still expanding, which supports the case for follow-through.
- Price is above SMA20 and sitting at the top of the range, but SMA50 at 42.16 has not been decisively cleared.
- Bollinger width is only 5.0%, so the squeeze may still be waiting to resolve rather than already confirming direction.
- Verdict invalidated if price falls below 40.64, which would break near-term support and weaken the current structure.
- Ideal entry range: 42.16 to 42.60
- Exit target: 45.15
- Stop loss protection: 40.64
In plain English, the chart says UOB looks firmer than it did a few sessions ago, but it still needs confirmation before the move can be treated as something more than a strong push into resistance.
Summary Data UOB
| Last price | 42.80 SGD |
| Change 1 day / 5 days / 1 month | 1.66% / 3.56% / 4.11% |
| Trend / MA-cross | sideways / none |
| SMA20 / SMA50 | 41.55 / 42.16 |
| RSI (14) / Stochastic %K | 60.6 / 78.9 |
| Bollinger %B / ATR | 110% / 0.71 |
| Support / Resistance 20 days | 40.64 / 42.80 |
| Data as of | 22 September 2026 08:00 WIB |



