Singtel Stock Technicals Today: Drops 0.93%, Testing Support Level
On September 24, 2026: price 4.28 SGD, trend sideways, RSI 32.1, support 4.28, resistance 4.56. technical analysis of singtel stock. Singtel Stock Technicals —…

Singapore Telecom’s shares on the SGX slipped to SGD 4.28 on 23 September 2026, down from SGD 4.32 previously, as the stock stayed pinned near the bottom of its short-term range and below key moving averages. The move matters less as a one-day dip than as a signal: sellers still have the upper hand, even though the tape is not showing a full breakdown yet. The price is now sitting right on support at SGD 4.28, which makes this session a test of whether the market sees value here or whether it is preparing for another leg lower.
Trend & Price Action
The chart shows Singtel trading in a sideways trend, but that label hides the more important detail: the slope of the SMA20 is -0.64% over 5 days, which means the short-term trend is leaning down rather than flat in practice. Price is also below the SMA20 at SGD 4.46 and just under the SMA50 at SGD 4.44, so the stock is failing to reclaim the levels that often act as a first sign of stabilization. There has been no new MA-cross, which tells traders that the medium-term trend has not produced a fresh bullish or bearish trigger; instead, the stock is drifting under pressure.
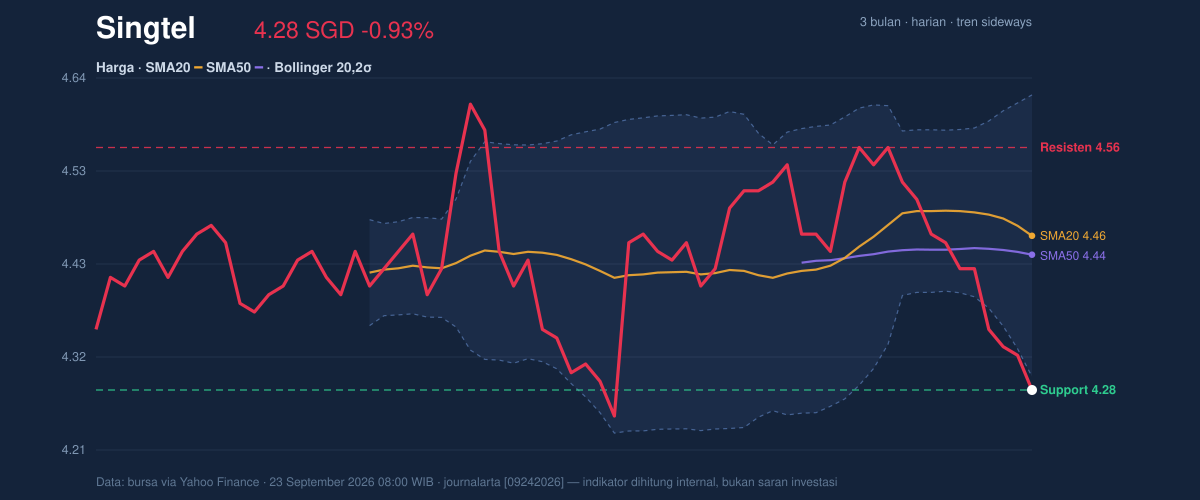
The broader range adds context. Singtel’s 3-month high is SGD 4.70 and the 3-month low is SGD 4.19, placing the current price closer to the lower end of that band than the upper. That positioning usually signals caution because the market is paying more attention to downside defense than upside expansion. The fact that the stock is at 0% of the 20-hour range also means the latest trade is at the floor of the near-term channel, not in the middle where price discovery is more balanced.
Oscillators & Momentum
Momentum indicators are mixed, but the mix is not neutral in the way a casual glance might suggest. RSI(14) at 32.1 is close to oversold territory, which means the stock has been sold enough that a reflex bounce is possible. At the same time, “near oversold” is not the same as “reversal confirmed”; it often marks a market that is weak but increasingly stretched.
The stochastic oscillator is more explicit. Stochastic %K at 0.0 and %D at 4.0 show the stock is deeply oversold, which usually means the latest price action has been weak enough to compress short-term momentum to the floor. That can set up a rebound, but only if price starts closing back above nearby resistance. Without that, oversold readings can stay oversold for longer than traders expect.
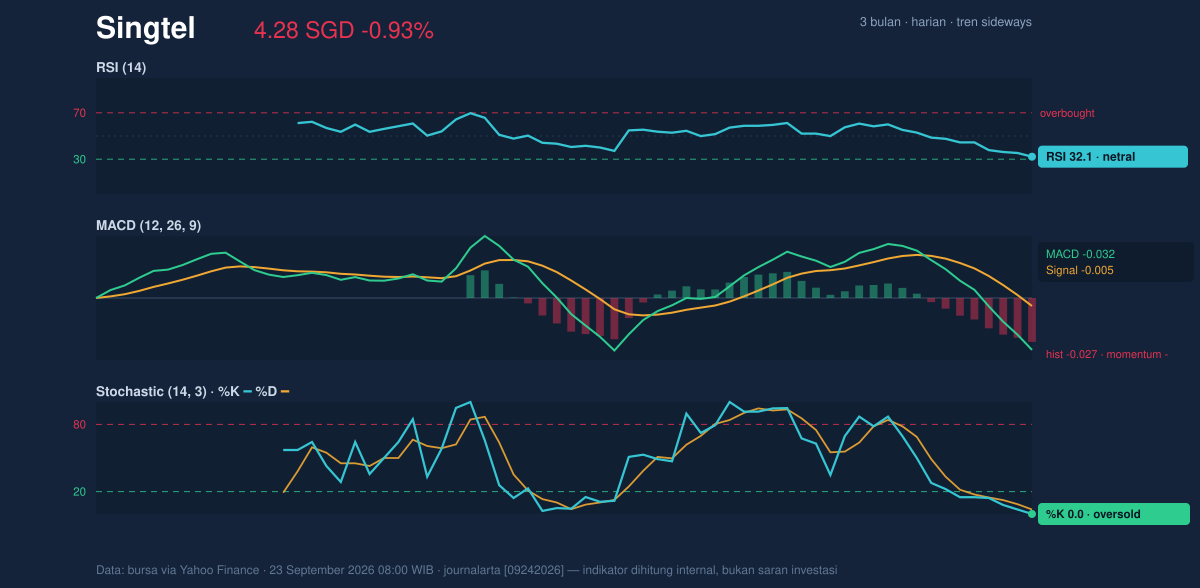
The MACD at -0.032, below its signal line at -0.005, with a histogram of -0.027, is the clearest sign that trend momentum remains negative. In plain English, the faster-moving average embedded in MACD is still lagging the slower one, so the stock has not yet generated the kind of momentum shift that would confirm a durable turn. That matters because oversold oscillators can tempt buyers early, but MACD says the broader impulse is still down.
Volatility & Volume
Volatility is contained, but not asleep. The Bollinger Bands are tightening, with the band width at 7.3%, and that narrowing suggests a squeeze — a phase where price compresses before a larger move. The lower band sits at SGD 4.30, just above the latest price, while the middle band is at SGD 4.46 and the upper band at SGD 4.62. With %B at -5%, the stock is trading below the lower band, which is usually a sign of downside extension rather than healthy consolidation. That does not guarantee further losses, but it does show the market is already stretched on the weak side.
The ATR(14) at 0.07, or 1.6% of price, says day-to-day movement is moderate rather than explosive. That combination — a squeeze in Bollinger Bands and a mid-range ATR — often means the next directional move could be sharper than recent trading, even if the current session itself looks quiet. Volume supports the idea that this is not a dead market. Last volume was 27,657,100, about 1.4× normal versus the 20-hour average of 20,423,682, while OBV is falling. In practical terms, more shares are changing hands, but the balance of that trading still favors distribution rather than accumulation.
Key Levels & Scenarios
The immediate line in the sand is SGD 4.28 support. If that level fails, the chart loses its nearest defense and price would be exposed to the lower edge of the recent range near SGD 4.19. On the upside, the first meaningful checkpoint is SGD 4.30, the lower Bollinger Band, followed by the SMA50 at SGD 4.44 and the SMA20 at SGD 4.46. Above that, SGD 4.56 resistance becomes the level that would show buyers have regained control of the short-term tape.
The signal hierarchy is important here. Oversold stochastic and a near-oversold RSI suggest the stock is vulnerable to a bounce, but MACD remains negative, price is below both moving averages, and OBV is declining. That is why the chart still reads as weak even though the oscillator picture is stretched. A rebound would need to prove itself by reclaiming the band and moving-average cluster; until then, the squeeze looks more like a coiled spring under pressure than a clean base.
Technical Verdict: HOLD (wait & see)
- Reason 1: RSI at 32.1 and Stochastic %K at 0.0 show the stock is oversold, but not yet confirmed to have turned.
- Reason 2: MACD is negative and price remains below SMA20 at 4.46 and SMA50 at 4.44, which keeps the trend bias weak.
- Reason 3: Bollinger Bands are squeezing and OBV is falling, so the next move could be meaningful but the current direction still favors caution.
- Verdict invalidated if price breaks below SGD 4.19, the 3-month low and the clearest nearby downside reference.
- Ideal Entry Range: SGD 4.28 to SGD 4.30
- Exit Target (Target Price): SGD 4.44 to SGD 4.46
- Stop Loss protection: below SGD 4.19
For non-traders, this means Singtel is weak enough to demand patience, but stretched enough that the next move could still be a rebound if support holds.
Summary Data Singtel
| Last price | 4.28 SGD |
| Change 1 day / 5 days / 1 month | -0.93% / -3.17% / -5.10% |
| Trend / MA-cross | sideways / none |
| SMA20 / SMA50 | 4.46 / 4.44 |
| RSI (14) / Stochastic %K | 32.1 / 0.0 |
| Bollinger %B / ATR | -5% / 0.07 |
| Support / Resistance 20 days | 4.28 / 4.56 |
| Data as of | 23 September 2026 08:00 WIB |


