DIS Stock Technicals Today: Gains 2.03%, Momentum Weakens
On September 25, 2026: price 105.56 USD, trend sideways, RSI 50.9, support 102.67, resistance 109.63. technical analysis of dis stock. DIS Stock Technicals —…

At $105.56, Walt Disney is trading below its 20-day average of $106.18 but still above the 50-day average of $103.22, a setup that points to a market that has not broken down, yet has not reclaimed short-term control either. The shares are up 2.03% on the day, but the broader tape remains mixed: -1.34% over 5 days and -5.11% over 1 month. In plain terms, the stock is stuck in a sideways band, and the chart is now asking whether recent stabilisation is the start of a turn or just a pause within a drift lower.
Trend & Price Action
The most important signal in the price structure is that Disney is trading beneath the 20-day SMA while the 50-day SMA remains below price. That combination usually means the stock sits in a transition zone: short-term momentum has softened, but the medium-term trend has not fully rolled over. The SMA20 slope of -1.05% over 5 days reinforces that the near-term trend is still leaning down, even if only modestly. There is no fresh MA-cross, which matters because a new moving-average crossover often marks a change in market leadership; here, the absence of one suggests the market has not yet committed to a new trend.
The Bollinger structure, shown in the chart below, adds another layer. With the middle band at $106.18, Disney is effectively hovering around the pivot point that separates strength from weakness. The upper band at $109.63 and lower band at $102.73 frame the current battle line. Price is near the middle of that range, not at an extreme, which usually means traders are waiting for confirmation rather than chasing direction.
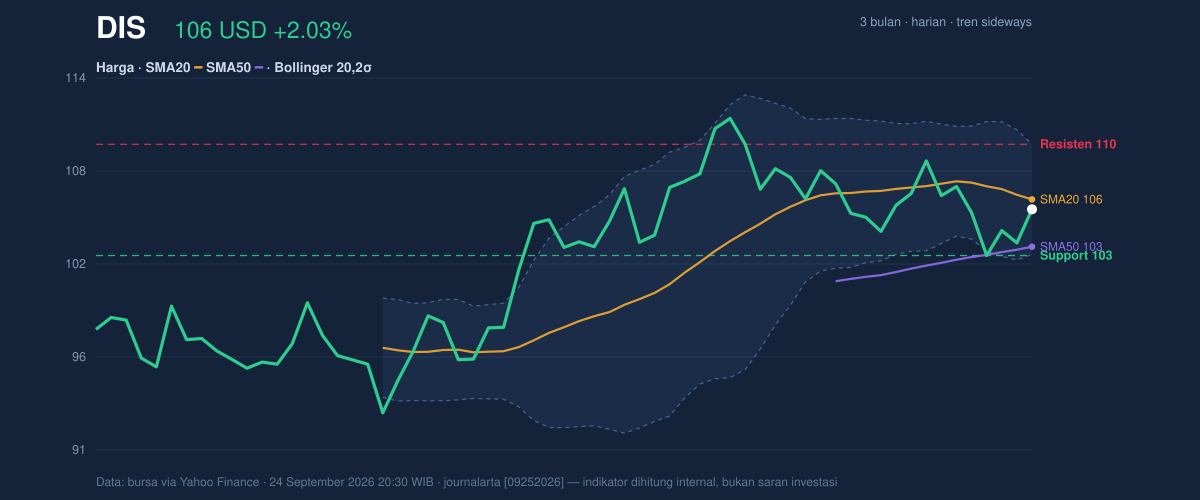
A short line tells the story: Disney is compressed, not resolved.
Oscillators & Momentum
The momentum picture is more cautious than the price action alone might suggest. RSI at 50.9 is almost perfectly neutral, which means the stock is neither overbought nor oversold. That is important because neutral RSI often appears when a market is balancing competing narratives rather than trending decisively. The Stochastic %K at 45.2 and %D at 29.0 is also neutral, though the gap between the two lines hints at some early upward repair in short-cycle momentum. Still, that is not the same as a confirmed reversal.
The more meaningful warning comes from MACD at 0.092 versus signal at 0.595, with a histogram of -0.502. In practical terms, MACD measures whether recent price action is gaining or losing force. A negative histogram means the stock’s recent movement is still lagging the trend signal line, so momentum remains negative even if price has bounced. That is why the latest daily gain should be treated carefully: it is a recovery attempt, not yet proof of trend change.
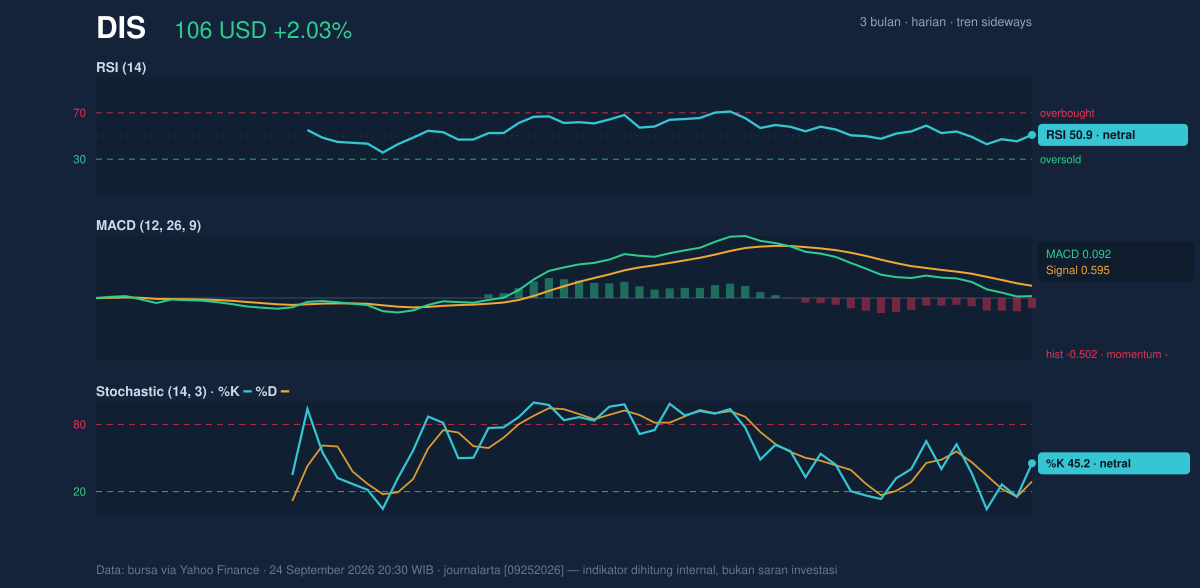
Momentum is neutral on the surface, but the MACD says the tape still has work to do.
Volatility & Volume
The Bollinger Bands are narrowing, with a 6.5% width, which is a classic squeeze condition. A squeeze does not predict direction, but it does tell readers the stock is storing energy. When volatility contracts, the next move often becomes sharper than recent day-to-day trading would imply. The ATR(14) of 2.24, equal to 2.1% of price, supports that reading: Disney is moving, but not violently. That makes the band compression more important, because a modest-volatility stock in a squeeze can still produce a meaningful break once participation rises.
Volume is close to normal at 7,884,200 versus a 20-day average of 8,202,395, or about 1.0x normal. That matters because price moves without volume usually lack conviction. Here, the latest bounce is not being powered by a surge of new demand, which tempers enthusiasm. On the other hand, OBV is rising, and that is a constructive sign: on-balance volume tracks whether money is flowing into the stock over time, not just on one session. Rising OBV while price sits near the middle of the range can indicate quiet accumulation, even if the breakout has not arrived yet.
Key Levels & Scenarios
The chart shows Disney sitting 42% of the way through its 20-day range, which places it closer to support than resistance, but not at a decisive test. The key levels are clear: support at $102.67 and resistance at $109.63. Those are the levels that define the next move. If the stock holds above support and pushes back through the $106.18 SMA20, the market would be signaling that the recent weakness is fading. If it fails and slips below $102.67, the squeeze setup would likely resolve in a more defensive direction.
The 3-month high of $111.87 and 3-month low of $92.49 give the broader frame. Disney is trading much nearer the upper half of that window, which means the stock has already recovered a substantial part of its earlier damage, but it has not yet proven it can sustain a move into the top of the range. That is where the next signal will matter most.
Technical Verdict: HOLD (wait & see)
HOLD (wait & see)
- RSI at 50.9 and Stochastic at 45.2 / 29.0 are neutral, so momentum is not strong enough to confirm a directional break.
- MACD histogram at -0.502 keeps the short-term momentum negative, even though price has bounced.
- Bollinger Bands are squeezing and price is near the middle band, which argues for patience until the range resolves.
Verdict invalidated if price breaks below $102.67.
- Ideal Entry Range: $102.73 to $106.18
- Exit Target: $109.63
- Stop Loss protection: below $102.67
For non-traders: Disney is not giving a clean trend signal yet, so the chart says wait for the next decisive move rather than reading too much into one day’s bounce.
“The market is still deciding whether this is a pause or a turning point.”
Summary Data DIS
| Last price | 105.56 USD |
| Change 1 day / 5 days / 1 month | 2.03% / -1.34% / -5.11% |
| Trend / MA-cross | sideways / none |
| SMA20 / SMA50 | 106.18 / 103.22 |
| RSI (14) / Stochastic %K | 50.9 / 45.2 |
| Bollinger %B / ATR | 41% / 2.24 |
| Support / Resistance 20 days | 102.67 / 109.63 |
| Data as of | 24 September 2026 20:30 WIB |

