LLY Stock Gains 2.68% Today, Testing Key Resistance
On September 25, 2026: price 1,181.89 USD, trend sideways, RSI 55.6, support 1,115.70, resistance 1,189.41. technical analysis of lly stock.

Eli Lilly shares rose 2.68% to $1,181.89 on the NYSE, moving back above the short-term average and pressing toward the top of their recent trading band, according to exchange data. The move matters because it is not just a one-day bounce: the stock is now sitting near a level where momentum can either extend into a breakout or stall if buyers fail to keep pace with the pace of the rise.
Trend & Price Action
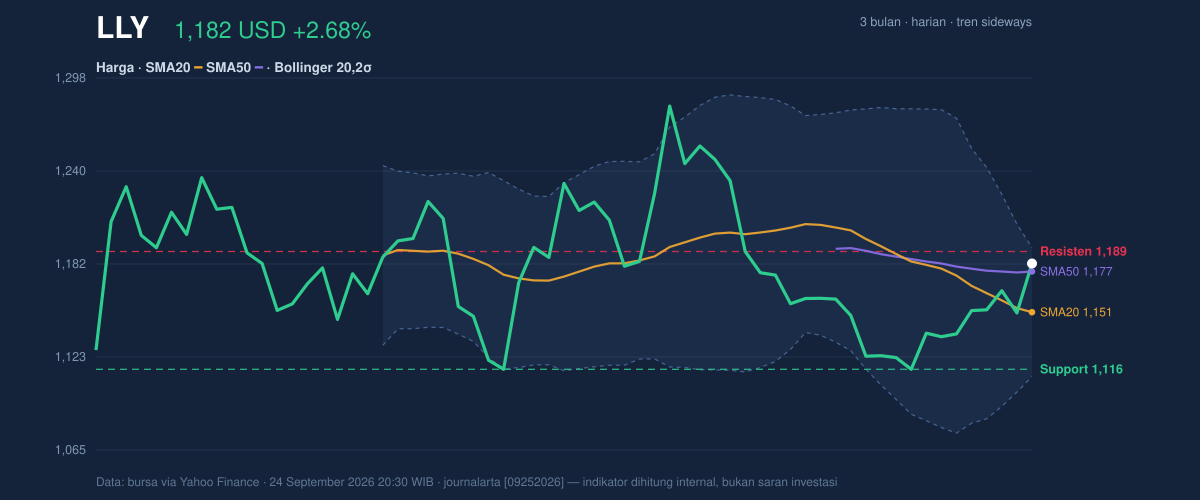
The chart shows a stock that is still technically in a sideways trend, but one with a subtle upward bias in the near term. Lilly is trading above its SMA20 at $1,151.40 and just above the SMA50 at $1,176.86, which tells traders that the latest price recovery has pushed the shares back into a stronger short-term position. That is important because when price reclaims both moving averages, it often signals that recent selling pressure is being absorbed rather than accelerating.
At the same time, the slope of the SMA20 is still negative, down -1.95% over five days. That means the broader short-term trend has not fully turned up, even if the latest price action looks firmer. In plain language, the stock is climbing inside a still-flat-to-soft structure, not breaking out from a clean uptrend.
The share price is also trading at roughly 90% of its 20-day range, with the 20-day resistance at $1,189.41 sitting just above the market and the 20-day support at $1,115.70 below. As shown in the chart, that places Lilly close to the upper edge of the recent range, where the market usually demands fresh buying interest to keep rising. The stock’s 3-month high of $1,292.65 and 3-month low of $1,109.15 frame the larger battle: the current price is much closer to the ceiling than the floor, but still well short of a true trend reset.
Oscillators & Momentum
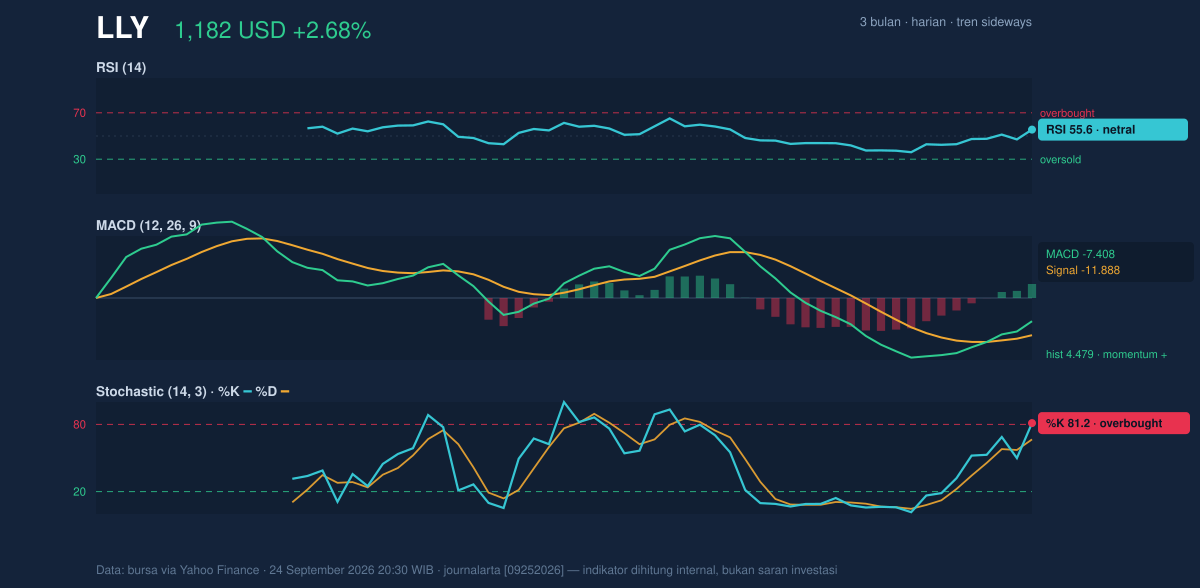
Momentum is mixed, and that mix is what makes the current setup interesting. The RSI at 55.6 is neutral, which means the stock is not stretched on the upside and is not showing the kind of weakness that usually accompanies a breakdown. By itself, that reading suggests room for further movement in either direction.
The Stochastic oscillator is overbought, with %K at 81.2 and %D at 66.6. That does not automatically mean the stock must reverse, but it does mean the latest climb has moved far enough, fast enough, to raise the risk of a pause. In practical terms, stochastic overbought conditions often show that short-term momentum has outrun the market’s ability to absorb gains without a breather.
The more constructive signal comes from MACD. The MACD at -7.408 remains below zero, but the signal line at -11.888 is lower still, leaving a positive histogram of 4.479. That combination means bearish momentum is fading and the stock is gaining internal strength, even if it has not yet crossed into a fully bullish regime. As shown in the momentum chart, this is the sort of configuration that often appears before a more decisive move, provided price confirms it.
Volatility & Volume
Volatility is not extreme, but it is not sleepy either. The ATR(14) of 28.16, or 2.4% of price, suggests the stock can move meaningfully in either direction in a normal session. That matters because Lilly is also sitting inside a Bollinger Band squeeze, with the bands only 7.0% wide. A squeeze usually means the market has compressed after a period of indecision, and compression often comes before expansion. The question is direction.
Price is near the top of the band structure, with %B at 88% and the upper band at $1,191.71. That tells readers the stock is trading close to the upper boundary of its recent volatility envelope. If price can close through that area, the market may be signaling that buyers are willing to pay up for a fresh leg higher. If it cannot, the same setup can quickly turn into a short-term fade.
Volume offers modest confirmation rather than a dramatic vote. Last volume was 2,417,700, almost exactly in line with the 20-day average of 2,411,410, or 1.0x normal. That means the move higher is not being driven by an obvious surge in participation, but OBV is rising, which suggests the balance of buying has been better than selling over time. In other words, the market is accepting higher prices without showing panic or exhaustion.
Key Levels & Scenarios
The immediate line in the sand is the $1,189.41 resistance, followed by the $1,191.71 Bollinger upper band. A sustained move above both would strengthen the case that the current squeeze is resolving upward. On the downside, $1,176.86 is the first important pivot because it is the SMA50, and a slip back below it would weaken the near-term recovery. Below that, $1,151.40 marks the SMA20, and $1,115.70 is the more important support from the 20-day range.
The market is effectively asking whether Lilly can hold the recent reclaim of its moving averages long enough to challenge the upper band. If it does, the chart would shift from recovery mode toward breakout mode. If it fails, the sideways pattern remains intact and the recent gain becomes just another swing inside the range.
Technical Verdict: HOLD (wait & see)
HOLD (wait & see)
- RSI is neutral at 55.6, so the stock is not overextended, but it also is not showing a decisive momentum breakout.
- MACD is improving with a positive histogram of 4.479, yet the broader trend is still only sideways and the SMA20 slope is negative.
- Stochastic is overbought near the top of the range, which raises the risk of a pause just as price approaches resistance.
- Verdict invalidated if price falls below $1,176.86 and then loses the $1,151.40 area, because that would weaken the current recovery and hand control back to sellers.
- Ideal Entry Range: $1,176.86 to $1,189.41
- Exit Target: $1,191.71 to $1,192 area
- Stop Loss protection: below $1,151.40, with deeper risk control near $1,115.70
For non-traders, this means Lilly is improving, but the chart still needs proof before the latest climb can be treated as more than a short-term rebound. “The stock is close to the edge of the range now, and the next move will show whether buyers are serious or just passing through.”
Summary Data LLY
| Last price | 1,181.89 USD |
| Change 1 day / 5 days / 1 month | 2.68% / 3.87% / -4.20% |
| Trend / MA-cross | sideways / none |
| SMA20 / SMA50 | 1,151.40 / 1,176.86 |
| RSI (14) / Stochastic %K | 55.6 / 81.2 |
| Bollinger %B / ATR | 88% / 28.16 |
| Support / Resistance 20 days | 1,115.70 / 1,189.41 |
| Data as of | 24 September 2026 20:30 WIB |


