Momentum Weakens, VZ Stock Gains 1.72% Today
On September 25, 2026: price 47.32 USD, trend sideways, RSI 40.7, support 46.45, resistance 51.45. technical analysis of vz stock. Momentum Weakens — full…

Verizon Communications slipped to 47.32 USD on the NYSE, a modest rebound from the previous close of 46.52, but the tape still shows a stock that is trying to stabilize inside a broader sideways pattern rather than break out of it. The move matters because it came while the shares remained below SMA20 at 49.42 and below SMA50 at 48.02, meaning the price is still trading under both short- and medium-term trend markers even after the day’s gain.
Trend & Price Action
The chart shows a stock that is not in free fall, but it is also not reclaiming trend control. Verizon is sitting in a sideways structure, with the SMA20 slope down 1.31% over 5 days, a sign that the near-term drift is still leaning lower. That kind of slope usually means rallies are being sold into before they can mature into a trend change.
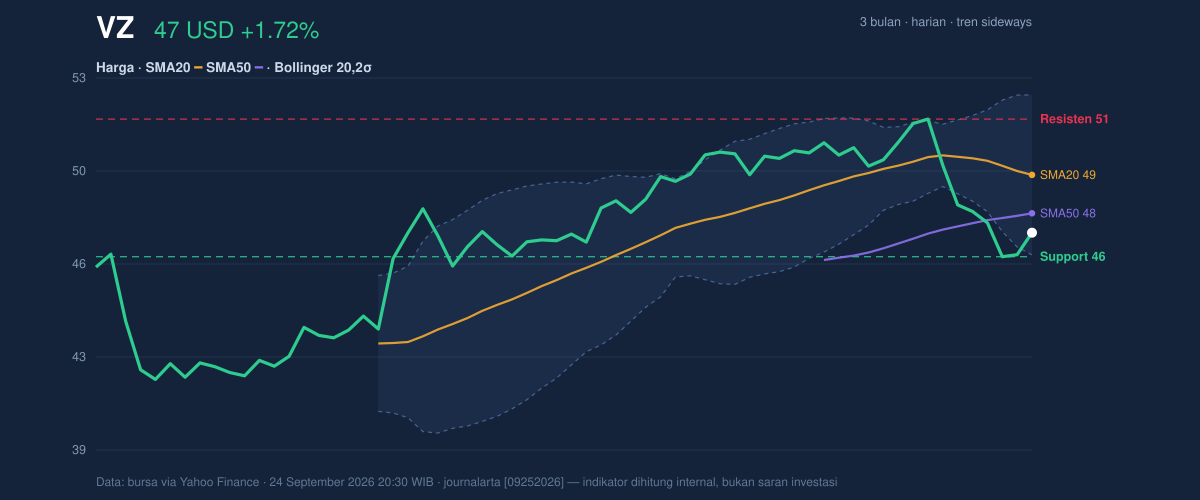
The positioning inside the recent range is also telling. The shares are trading near the lower half of the short-term band, with 20-hour support at 46.45 and 20-hour resistance at 51.45, and price is only about 17% of the way up that range. In plain language, the stock is closer to the floor than the ceiling, which often signals caution rather than momentum. The broader three-month frame reinforces that point: the stock has been moving between 51.67 and 40.76, so today’s level leaves it below the upper part of that band and still short of a clean recovery.
The Bollinger setup adds another layer. The middle band sits at 49.42, which matches SMA20, and price is below it. That usually means the market has not yet regained the short-term average price paid by traders over the last 20 sessions. The lower band at 46.51 is close to current price, so the stock is hovering near the area where downside pressure can start to meet bargain-hunting interest. With the band width at 11.8%, volatility is normal rather than stretched, suggesting the next move may still have room to develop rather than being exhausted.
Oscillators & Momentum
Momentum is mixed, but the bias is still weak. The RSI at 40.7 is neutral, which means Verizon is not oversold enough to scream rebound and not strong enough to signal broad upside conviction. That is important: neutral RSI in a stock below its key moving averages often describes a market that is waiting for a catalyst.
The stochastic reading is also muted. With %K at 21.1 and %D at 10.9, the stock is near the lower end of its recent momentum range, but not in a decisive oversold reversal pattern. In practical terms, that tells readers the stock is weak without being washed out.
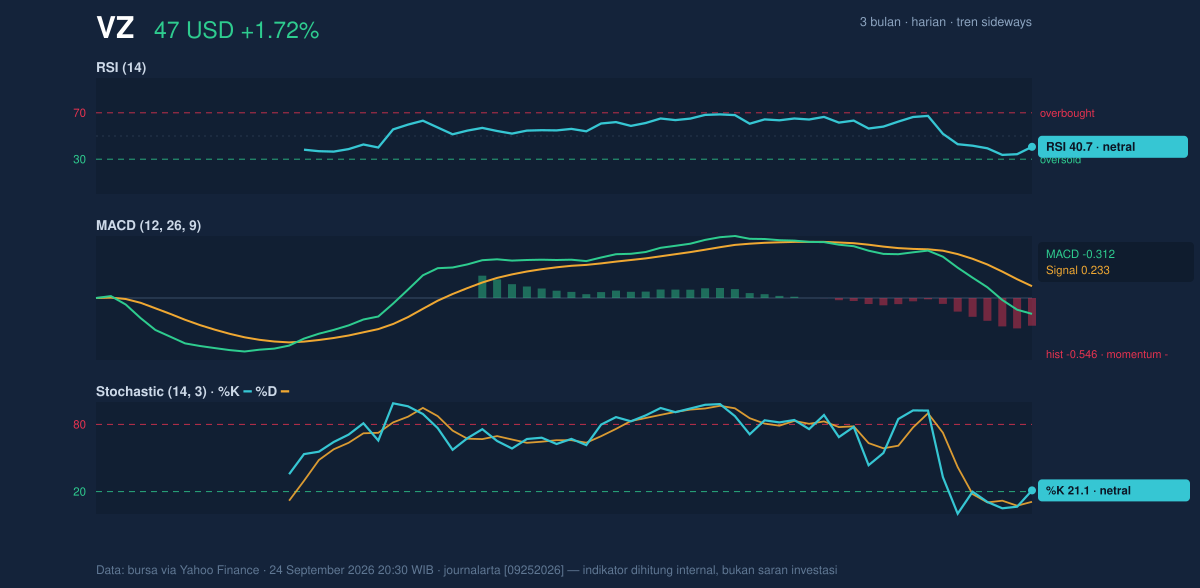
The clearest warning comes from MACD. Verizon’s MACD is -0.312, below the signal line at 0.233, and the histogram is -0.546. That combination means downside momentum is still dominating the shorter-term trend, even if the price has managed a one-day bounce. When MACD remains negative while price is below both moving averages, rallies tend to be treated as tests of resistance rather than evidence of a new trend.
Volatility & Volume
Trading activity does not yet show a strong conviction move. Volume came in at 21,038,900, almost exactly in line with the 20-day average of 21,371,290, or 1.0× normal. That matters because a price bounce on ordinary volume often lacks the force needed to overturn a weak technical setup. There is participation, but not enough to call it decisive.
The ATR at 1.14, or 2.4% of price, points to moderate volatility. That means daily swings are present, but not extreme. In a stock like Verizon, moderate ATR can make nearby support and resistance levels especially important, because the shares are moving enough to test them without the kind of violent gaps that would make the levels less reliable.
OBV, or on-balance volume, is down, which is another sign that volume has not been favoring accumulation. OBV falling while price is trying to recover often suggests that rallies are not yet being backed by steady buying pressure.
Key Levels & Scenarios
The key near-term line in the sand is 46.45 support, which is almost identical to the lower Bollinger band at 46.51. That alignment makes the area more important than a standalone number: if price slips below that zone, the stock would be breaking both a chart support and a volatility boundary at the same time.
On the upside, 48.02 and 49.42 are the first recovery markers to watch, because they correspond to SMA50 and SMA20. A move through those levels would not automatically change the broader picture, but it would show that Verizon is beginning to reclaim its recent average trading zone. Above that, 51.45 resistance is the next major ceiling, with the three-month high at 51.67 marking the edge of the recent range.
If price holds above 46.45, the stock can keep trying to rebuild from the lower part of the range. If it fails there, the chart would be signaling that the current base is not holding and that the recent bounce was only a pause inside a weak trend.
Technical Verdict: HOLD (wait & see)
HOLD (wait & see) fits the chart because Verizon is still below SMA20 at 49.42 and SMA50 at 48.02, while MACD remains negative and OBV is falling.
The RSI at 40.7 and stochastic near the lower end show weakness, but not a full capitulation signal.
The stock is also sitting close to 46.45 support and the 46.51 Bollinger lower band, which makes the next move more important than the current one.
- Ideal entry range: 46.45 to 48.02
- Exit target: 49.42, then 51.45
- Stop loss protection: below 46.45
This means the chart is not broken, but it has not earned a stronger verdict yet. Verizon needs to prove it can hold the lower edge of its range before the technical picture turns more constructive.
“Right now, the stock is asking for proof, not patience alone.”
Summary Data VZ
| Last price | 47.32 USD |
| Change 1 day / 5 days / 1 month | 1.72% / -2.09% / -5.72% |
| Trend / MA-cross | sideways / none |
| SMA20 / SMA50 | 49.42 / 48.02 |
| RSI (14) / Stochastic %K | 40.7 / 21.1 |
| Bollinger %B / ATR | 14% / 1.14 |
| Support / Resistance 20 days | 46.45 / 51.45 |
| Data as of | 24 September 2026 20:30 WIB |


