Singtel Stock Drops 0.70% Today, RSI Oversold
On September 25, 2026: price 4.25 SGD, trend sideways, RSI 29.8, support 4.25, resistance 4.56. technical analysis of singtel stock. Singtel Stock Drops — full…

Singapore Telecom (Singtel) on SGX slipped to SGD 4.25 from SGD 4.28, with the share now sitting at the very bottom of its recent trading band, according to Yahoo Finance data as of 24 September 2026 08:00 WIB. The move matters because it is not just a one-day dip: the stock is down 0.70% over one day, 3.85% over five days and 5.76% over one month, which tells investors the weakness has been building rather than arriving in a single shock. In plain terms, the market is pressing Singtel lower while waiting for evidence that selling pressure is tiring.
Trend & Price Action
The broader setup remains sideways, but the share is trading below SMA20 at 4.45 and only slightly above SMA50 at 4.43, as shown in the chart. That positioning is important because the 20-day average often acts like a short-term mood line: below it, traders are still leaning cautious, even if the longer average has not yet broken decisively. There is no new MA-cross, so this is not a clean trend reversal signal; instead, it suggests the stock is drifting in a weak range rather than transitioning into a fresh uptrend or downtrend. The SMA20 slope of -0.89% over 5 days adds another layer of pressure, showing that the short-term trend is still tilting down.
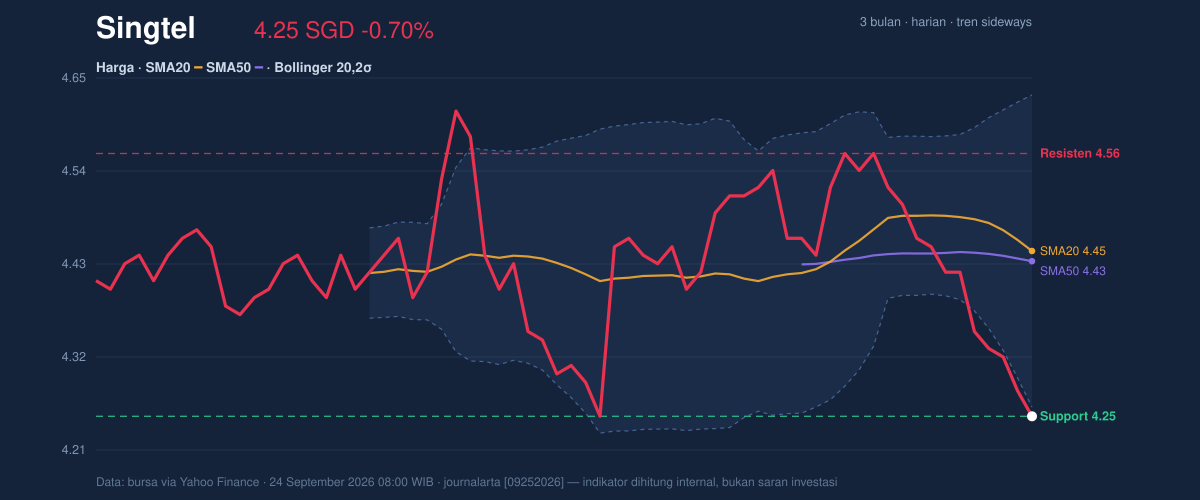
The price is also parked at support 4.25, which is notable because that level now doubles as the latest close and the floor of the 20-hour range. That means the market has already tested buyers’ willingness to defend this area, and the next reaction there will be telling. On the upside, resistance sits at 4.56, leaving the stock well below the point where recent sellers have been most active. The 3-month range reinforces the same message: Singtel is trading much closer to the 3-month low of 4.19 than the 3-month high of 4.70, a sign that sentiment has shifted toward caution without yet reaching a full breakdown.
Oscillators & Momentum
Momentum indicators are flashing a different message from the price trend, and that contrast is the main story in the chart. RSI at 29.8 is in oversold territory, while Stochastic %K at 6.1 and %D at 3.4 are also deeply oversold. In simple terms, these readings say the stock has fallen fast enough that short-term selling may be stretched, even if the broader trend has not turned up yet. Oversold does not guarantee a rebound, but it often means downside momentum is less efficient than it was a few sessions ago.
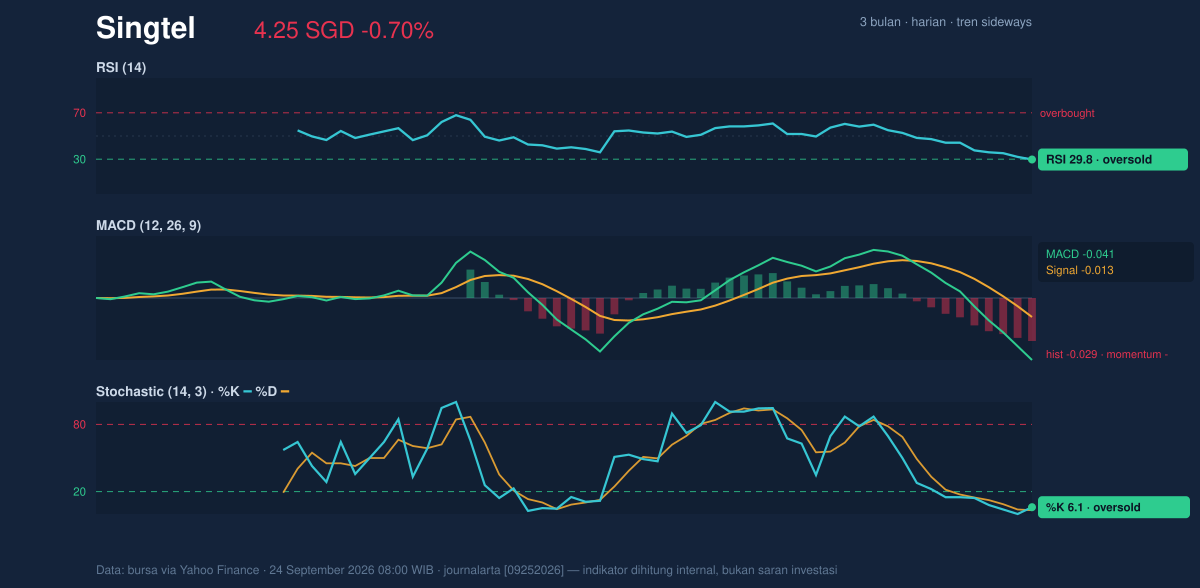
The caution flag is the MACD at -0.041 versus the signal line at -0.013, with a histogram of -0.029. That tells us momentum is still negative and has not yet crossed into recovery mode. So while RSI and Stochastic suggest the share is getting technically stretched, MACD says the down move is still active beneath the surface. When these indicators disagree, the safer reading is that the stock may be nearing a stabilization zone, but confirmation is still missing.
Volatility & Volume
Volatility is not extreme, but it is enough to keep the tape active. ATR(14) at 0.07, or 1.6% of price, points to moderate volatility, meaning daily swings are present but not disorderly. That matters because a stock sitting near support with moderate volatility can either base out cleanly or slip through the floor if sellers keep control. The Bollinger Bands also help frame that risk: the lower band is 4.26, the middle band is 4.45, and the upper band is 4.63. With %B at -3%, the share is trading just below the lower band, which often signals short-term exhaustion rather than healthy strength. The band width of 8.3% is described as normal, so this is not a volatility squeeze that usually precedes a sharp breakout; it is more a routine drift with a slight downside bias.
Volume confirms that the move has real participation. Last volume was 26,494,200, about 1.3× the 20-hour average of 20,714,982. That is important because a slide on heavier-than-normal volume usually means the market is not ignoring the move. At the same time, OBV is down, which suggests that accumulated trading flow has been leaving the stock rather than building a base underneath it. In other words, the recent weakness is being backed by participation, not just thin trading.
Key Levels & Scenarios
The key near-term map is clear. Support at 4.25 is the first line to watch, and the next layer below is the 3-month low at 4.19. If 4.25 fails to hold, the market would be signaling that the recent range is breaking down rather than merely wobbling. On the upside, 4.45 is the SMA20 and the Bollinger midline, so a move back above that area would be the first sign that the stock is trying to repair its short-term tone. Above that, 4.56 resistance is the next real hurdle, because that is where recent supply has capped the rebound.
Technical Verdict: HOLD (wait & see)
HOLD (wait & see) fits the current setup because the stock is technically stretched lower, but the trend has not yet turned. RSI at 29.8 and Stochastic at 6.1/3.4 argue that the downside may be mature in the short term, while MACD remains negative and the price is still below SMA20 at 4.45, which keeps the burden of proof on the bulls. The OBV decline and the close near support at 4.25 also warn that sellers still have influence. The verdict is invalidated if price falls below 4.19, because that would break the 3-month low and weaken the range structure further.
- Ideal entry range: 4.25 to 4.45
- Exit target: 4.56, then 4.63
- Stop loss protection: below 4.19
For non-traders, this means the share looks stretched lower, but it has not yet shown enough recovery to call the turn.
Summary Data Singtel
| Last price | 4.25 SGD |
| Change 1 day / 5 days / 1 month | -0.70% / -3.85% / -5.76% |
| Trend / MA-cross | sideways / none |
| SMA20 / SMA50 | 4.45 / 4.43 |
| RSI (14) / Stochastic %K | 29.8 / 6.1 |
| Bollinger %B / ATR | -3% / 0.07 |
| Support / Resistance 20 days | 4.25 / 4.56 |
| Data as of | 24 September 2026 08:00 WIB |



